ARM Help

Daily Management Report

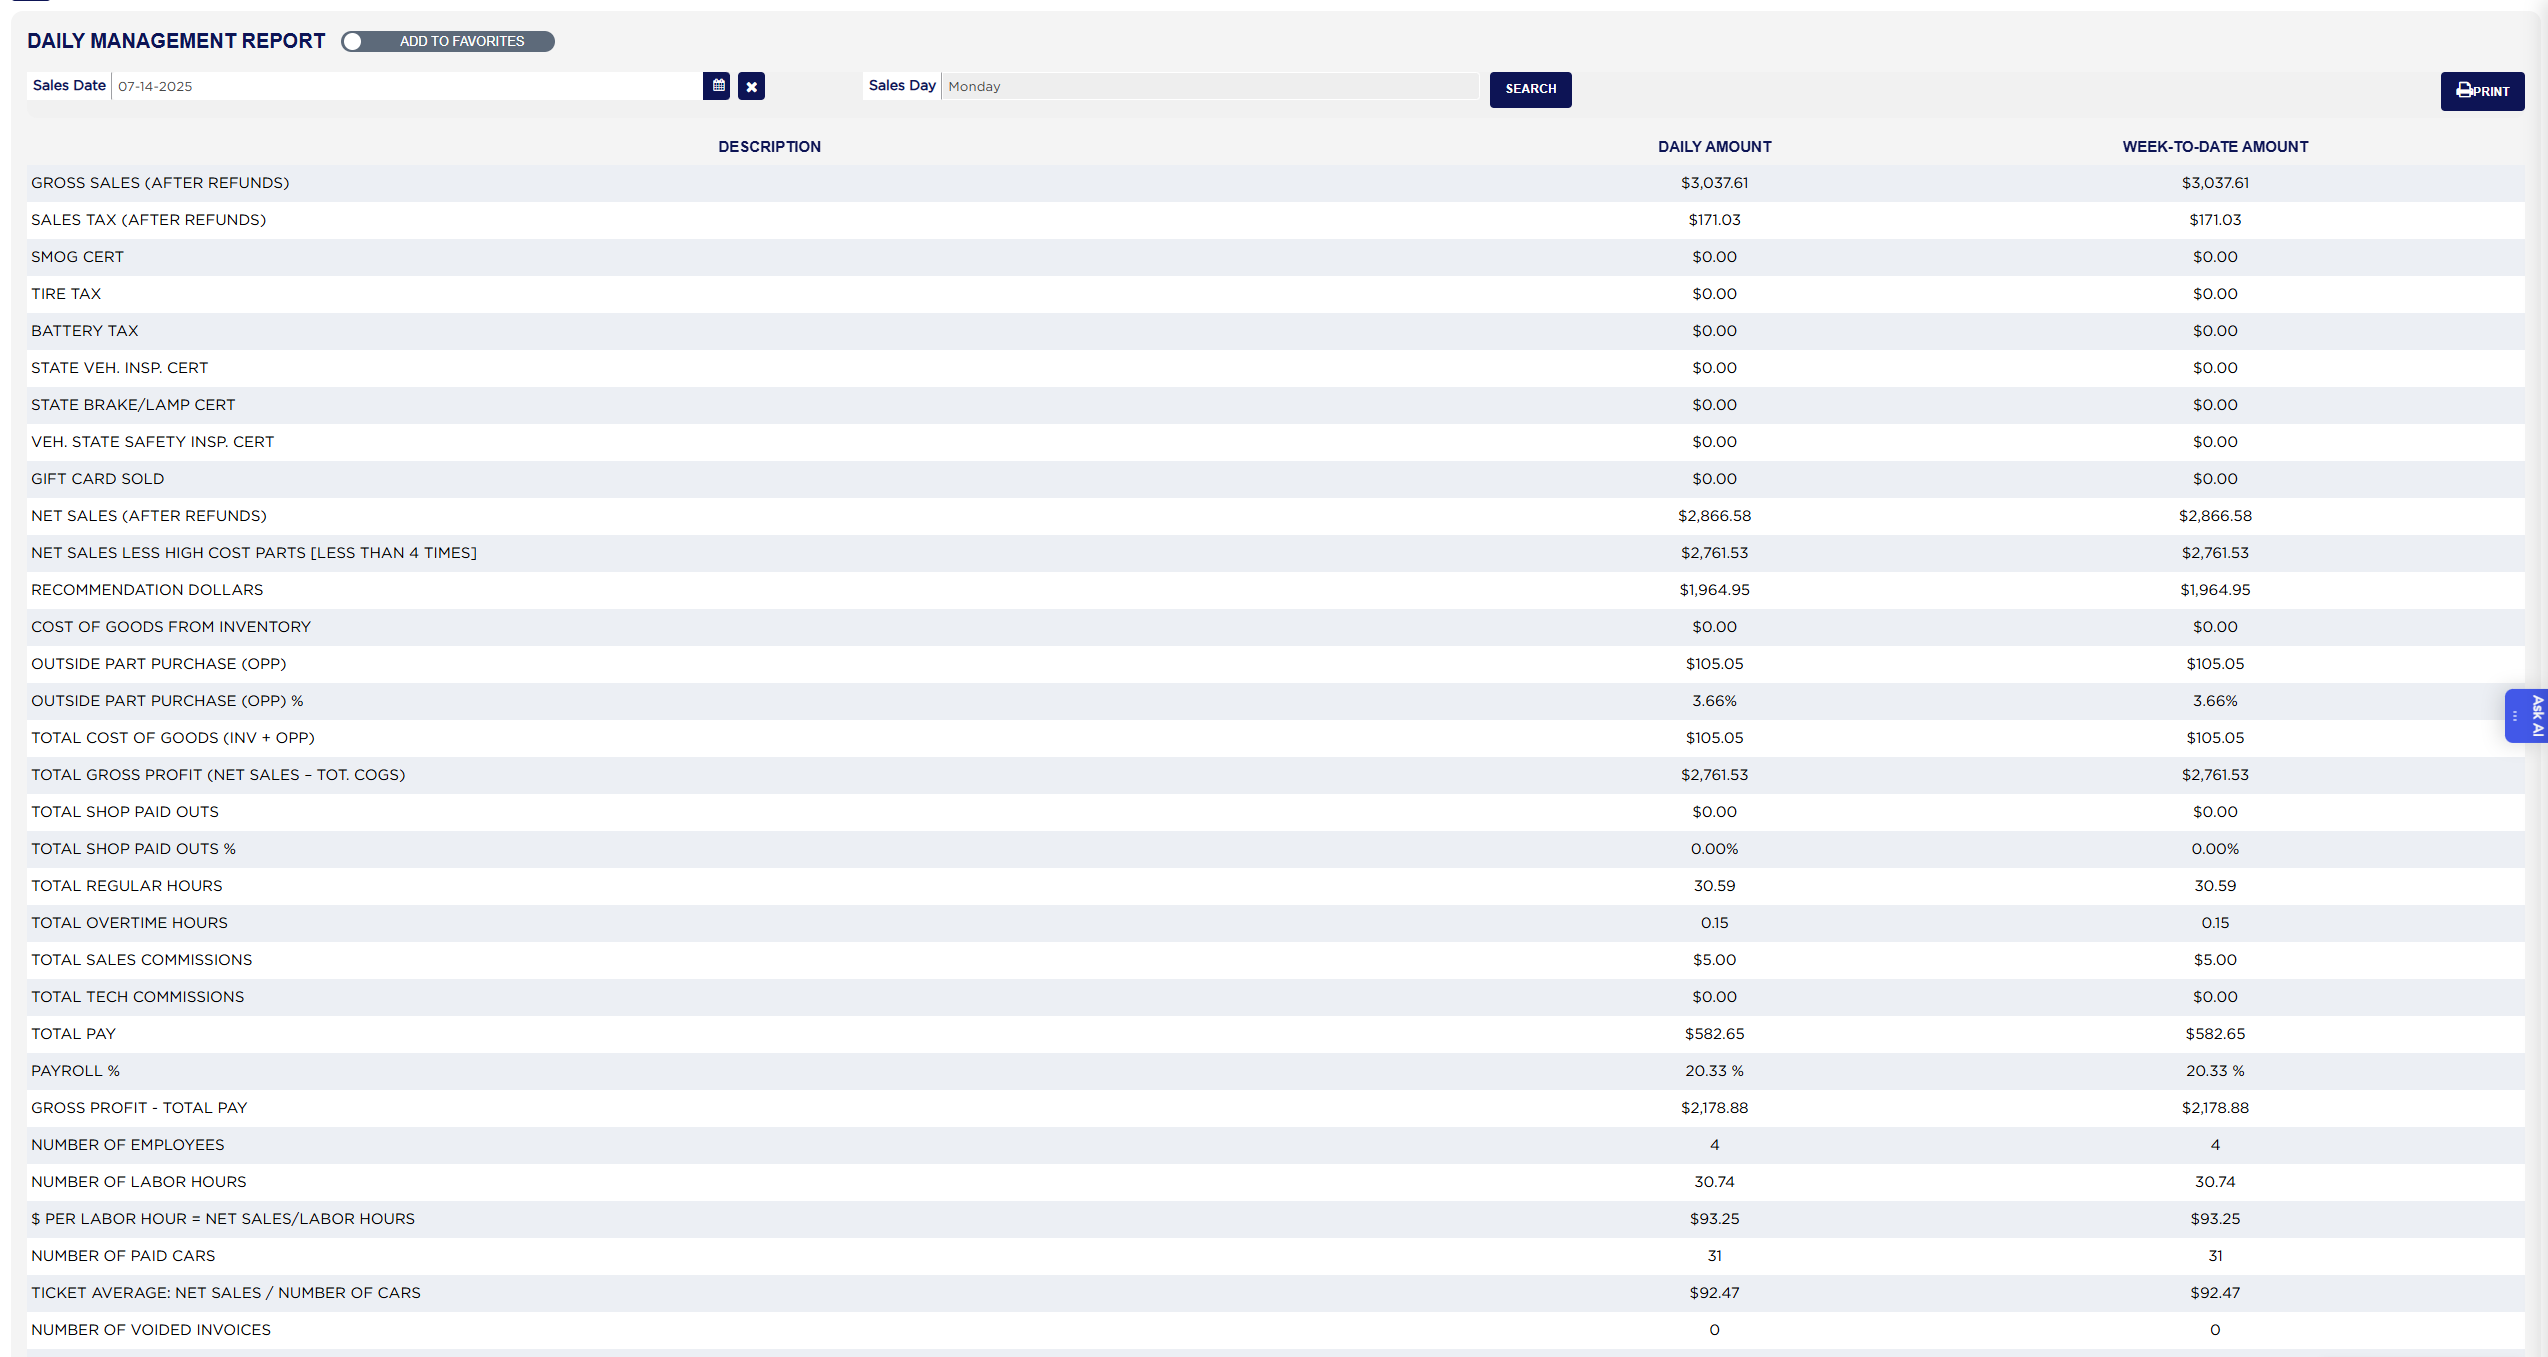
The Daily Management Report is the manager's one-page picture of a single day, with the week to date beside every figure. For the day you choose it lists the sales, taxes and fees, the cost of parts from stock and bought outside, the shop paid-outs, the payroll hours, commissions and pay, and the car counts and averages a shop is run by, each as a daily amount and a week-to-date amount. Below the figures it shows the cars still open, where the day's customers came from by referral source and ZIP code, and the invoices of the week where an outside part purchase left too little profit. Use it at closing to see how the day went, in the morning to compare the week so far against target, and to catch jobs where parts were bought too dear before the habit costs the month.

5 how-to answers 6 screenshots Open in ARM Markdown

How do I run the Daily Management Report? #

  1. From the Home Screen, click Reports → Management & Operational Reports → Daily Management Report.
  2. Click the Sales Date box or its calendar icon and pick the day. The report opens on today and reloads as soon as a date is chosen; days after today, or before the store's beginning date, cannot be picked. Sales Day beside it shows the weekday of the date you picked. The × clears the date.
  3. Click Search if you typed the date rather than picking it. A Loading Daily Management Report bar shows while the figures are gathered; the report needs a few seconds because it runs many totals at once.
  4. Read each line's DAILY AMOUNT and WEEK-TO-DATE AMOUNT. The week runs from Sunday to the selected date.
  5. Click Print for a PDF copy in a new tab; it prints the same figures with the low-profit invoice list on its own page.

How do I compare today with the week so far? #

  1. From the Home Screen, click Reports → Management & Operational Reports → Daily Management Report, and leave Sales Date on today.
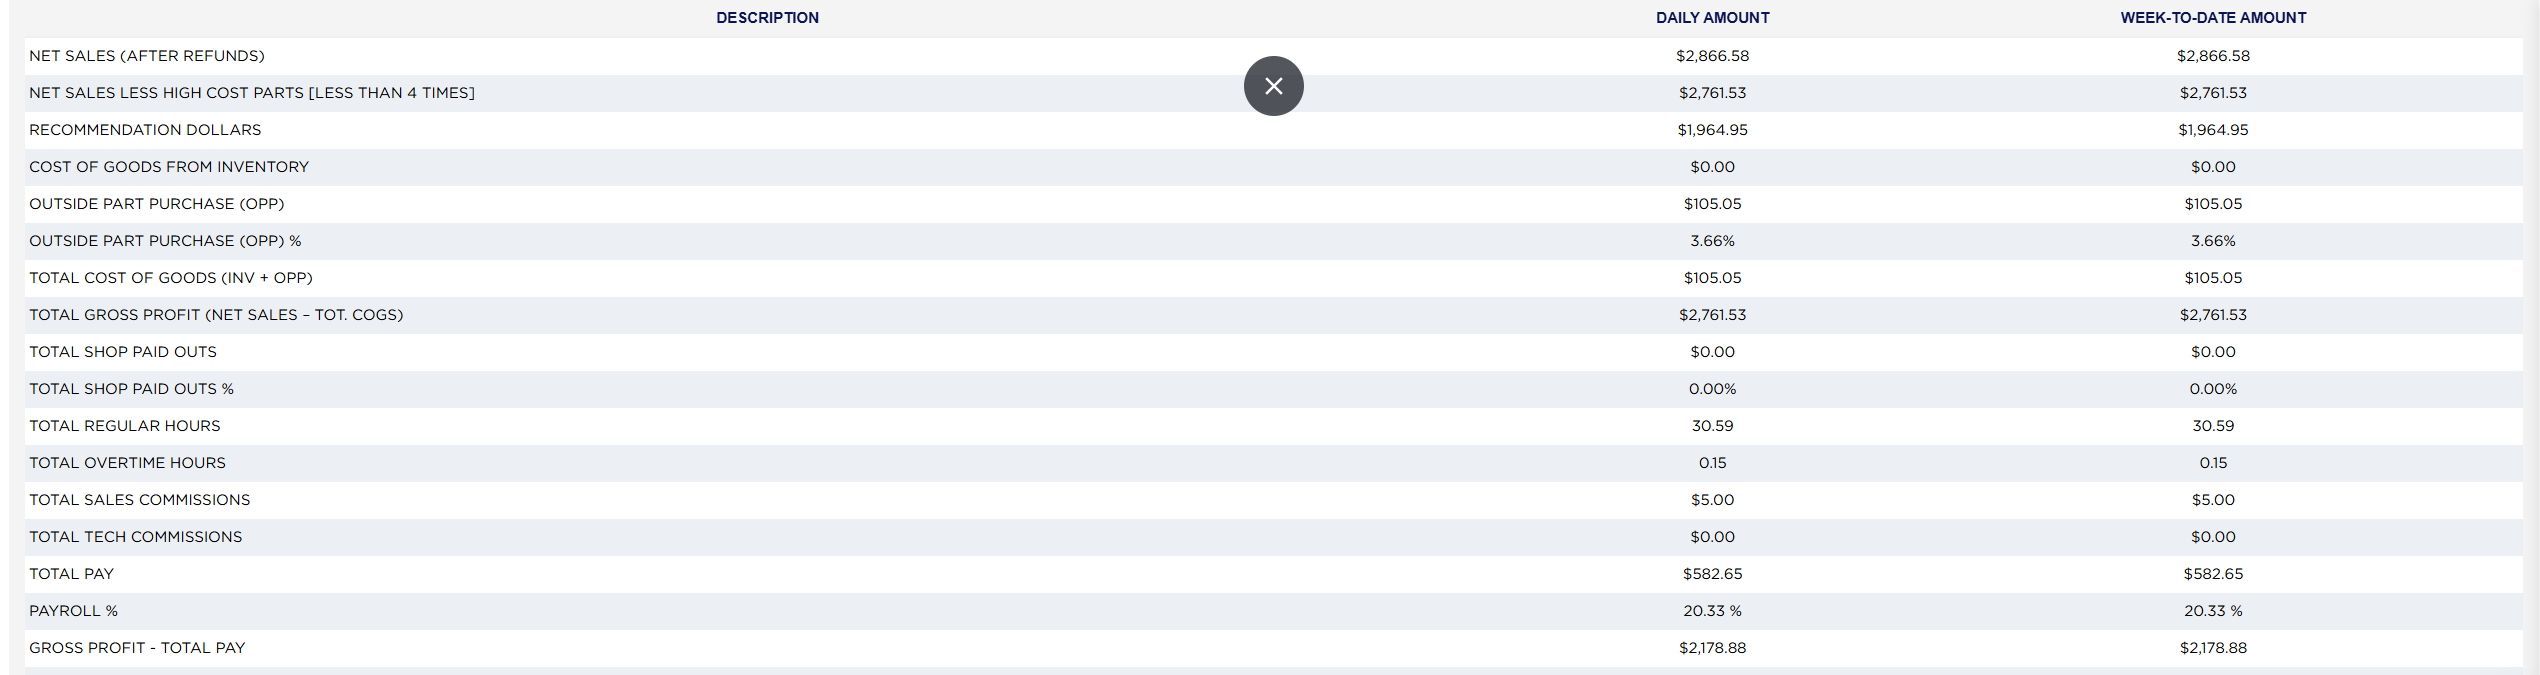
  2. Read NET SALES (AFTER REFUNDS), NUMBER OF PAID CARS and TICKET AVERAGE: NET SALES / NUMBER OF CARS in DAILY AMOUNT, then the same lines in WEEK-TO-DATE AMOUNT; dividing the week figure by the days open so far gives the daily pace.
  3. Check PAYROLL % and OUTSIDE PART PURCHASE (OPP) % on both columns: a day well above the week's percentage is the one to look into.
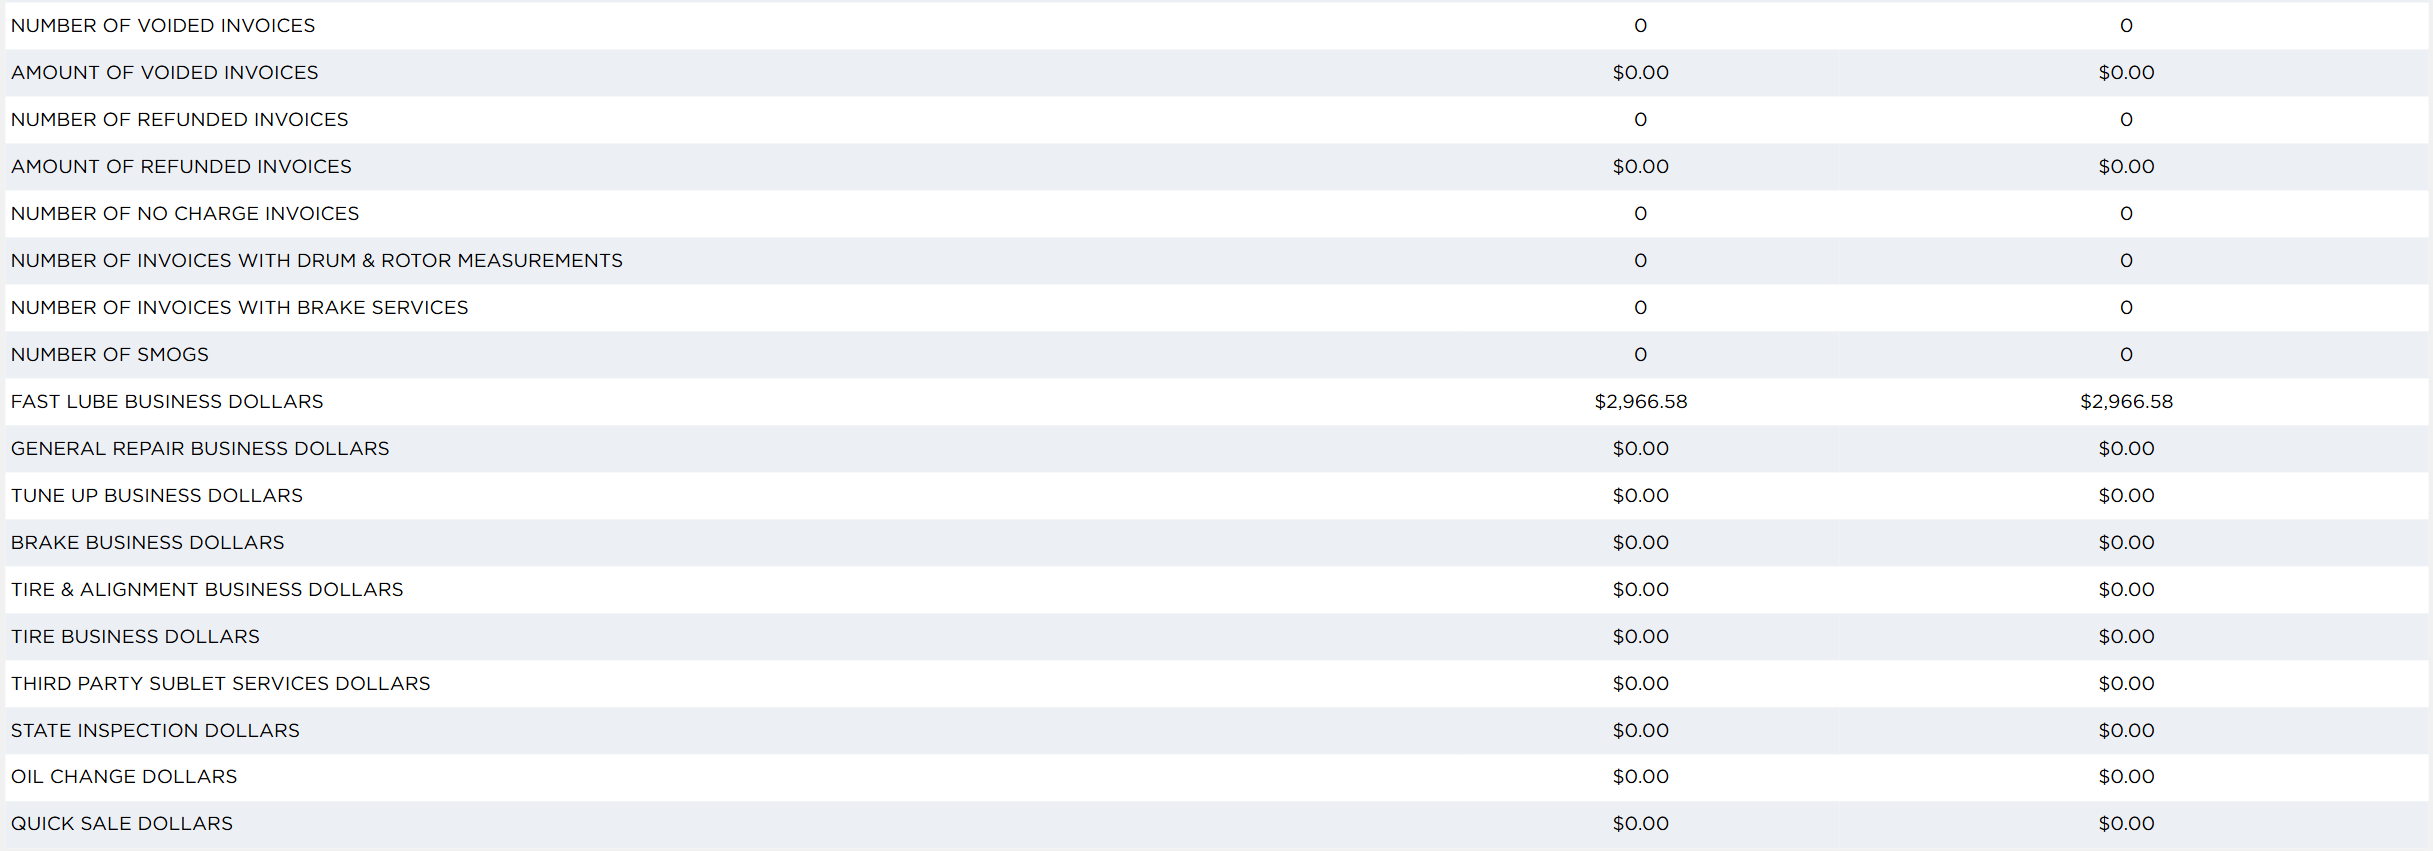
Daily Management Report voided, refunded, no charge and service dollars lines

How do I see yesterday's report? #

  1. From the Home Screen, click Reports → Management & Operational Reports → Daily Management Report.
  2. Click the calendar icon beside Sales Date and pick yesterday; the report reloads for that day with the week to date ending on it.
  3. Click Print to keep a copy for the daily file.

How do I follow the report from net sales down to gross profit less pay? #

  1. From the Home Screen, click Reports → Management & Operational Reports → Daily Management Report, pick the Sales Date and read the DAILY AMOUNT column.
  2. NET SALES (AFTER REFUNDS) is the net sales of every invoice finalized that day, leaving out voided and deleted invoices and any invoice refunded that day. Example: $4,000.00.
  3. COST OF GOODS FROM INVENTORY is the stock cost of the parts drawn from inventory for those invoices, lot by lot. Example: $900.00. OUTSIDE PART PURCHASE (OPP) is what was paid for parts bought outside for those invoices, as entered in Expenses. Example: $600.00, so OUTSIDE PART PURCHASE (OPP) % is $600.00 ÷ $4,000.00 × 100 = 15.00%.
  4. TOTAL COST OF GOODS (INV + OPP) is $900.00 + $600.00 = $1,500.00, and TOTAL GROSS PROFIT (NET SALES – TOT. COGS) is $4,000.00 − $1,500.00 = $2,500.00.
  5. TOTAL SHOP PAID OUTS is the stock parts, oil and shop paid-outs entered in Expenses with that day's expense date. Example: $250.00, so TOTAL SHOP PAID OUTS % is 6.25%.
  6. TOTAL PAY comes from the time sheets: each employee's regular hours at their rate plus overtime hours at their overtime rate (a daily-salaried employee counts the daily salary), plus the payroll tax rate set for their payroll class applied to that pay, plus TOTAL SALES COMMISSIONS and TOTAL TECH COMMISSIONS earned on the day's invoices. Example: $1,100.00, so PAYROLL % is $1,100.00 ÷ $4,000.00 × 100 = 27.50 %.
  7. GROSS PROFIT - TOTAL PAY is $2,500.00 − $1,100.00 = $1,400.00: what the day left after parts and people. The WEEK-TO-DATE AMOUNT column repeats every step over Sunday to the selected date.
Daily Management Report sales, cost of goods and payroll lines
Daily Management Report car counts, cars carried over, referrals and ZIP codes
Daily Management Report lines used in the net sales to gross profit less pay example

How do I read the high cost parts line and the low gross profit invoice list? #

  1. From the Home Screen, click Reports → Management & Operational Reports → Daily Management Report, and pick the Sales Date.
  2. For every finalized invoice with an outside part purchase, ARM divides the invoice's net sale by what the outside parts cost. An invoice is "high cost" when the result is under 4, that is, the sale was less than four times the parts cost. Example: a $300.00 invoice with $100.00 of outside parts gives 3.0, so it is high cost; a $500.00 invoice with $100.00 of parts gives 5.0 and is not.
  3. NET SALES LESS HIGH COST PARTS [LESS THAN 4 TIMES] is net sales less the outside part cost of all the high cost invoices. Example: $4,000.00 − $100.00 = $3,900.00.
  4. The List of Invoices with Low Gross Profit on Outside Parts Purchases takes the high cost invoices of the week to date and keeps those whose GP % is under 75, where GROSS PROFIT is the net sale less the outside parts cost and GP % is that divided by the net sale times 100. For the $300.00 invoice: $300.00 − $100.00 = $200.00, and $200.00 ÷ $300.00 × 100 = 66.67%, so it is listed with OPP $100.00 and NET/OPP 3.00.
  5. The TOTAL row sums the net sales, gross profit and OPP of the listed invoices and works the percentage and ratio from those totals.
List of Invoices with Low Gross Profit on Outside Parts Purchases
List of Invoices with Low Gross Profit on Outside Parts Purchases one line used in the example
About this screen

The main table has one line per figure with a DESCRIPTION, the DAILY AMOUNT for the selected date and the WEEK-TO-DATE AMOUNT from Sunday to that date. Unless a line says otherwise, it counts the invoices finalized in the period, leaving out voided and deleted invoices and any invoice refunded in the period. The sales lines are GROSS SALES (AFTER REFUNDS), SALES TAX (AFTER REFUNDS), the certificate and state fee lines SMOG CERT, TIRE TAX, BATTERY TAX, STATE VEH. INSP. CERT, STATE BRAKE/LAMP CERT and VEH. STATE SAFETY INSP. CERT, GIFT CARD SOLD (shown when your store sells gift cards, counted by the card's sale date), NET SALES (AFTER REFUNDS), NET SALES LESS HIGH COST PARTS [LESS THAN 4 TIMES] (net sales less the outside part cost of every invoice whose net sale was under four times what its outside parts cost) and RECOMMENDATION DOLLARS, the value of the recommended services written on those invoices. The cost lines are COST OF GOODS FROM INVENTORY (the stock cost of the parts taken from inventory for the invoices), OUTSIDE PART PURCHASE (OPP) (what was paid for parts bought outside for them) with its OUTSIDE PART PURCHASE (OPP) % of net sales, TOTAL COST OF GOODS (INV + OPP) and TOTAL GROSS PROFIT (NET SALES – TOT. COGS). TOTAL SHOP PAID OUTS is the stock parts, oil and shop paid-outs entered in Expenses for the period by expense date, with TOTAL SHOP PAID OUTS % of net sales. The payroll lines come from the time sheets: TOTAL REGULAR HOURS and TOTAL OVERTIME HOURS split by each employee's overtime rule, TOTAL SALES COMMISSIONS and TOTAL TECH COMMISSIONS earned on the period's invoices, TOTAL PAY (regular and overtime pay plus commissions and the payroll tax rate set for each payroll class), PAYROLL % of net sales and GROSS PROFIT - TOTAL PAY, what is left of the gross profit after the people are paid.

The count lines follow: NUMBER OF EMPLOYEES and NUMBER OF LABOR HOURS from the time sheets, $ PER LABOR HOUR = NET SALES/LABOR HOURS, NUMBER OF PAID CARS (finalized invoices, including those with nothing to pay), TICKET AVERAGE: NET SALES / NUMBER OF CARS, NUMBER OF VOIDED INVOICES and AMOUNT OF VOIDED INVOICES (by invoice date), NUMBER OF REFUNDED INVOICES and AMOUNT OF REFUNDED INVOICES (by refund date, showing the full invoice amount), NUMBER OF NO CHARGE INVOICES (finalized at zero), NUMBER OF INVOICES WITH DRUM & ROTOR MEASUREMENTS, NUMBER OF INVOICES WITH BRAKE SERVICES and NUMBER OF SMOGS, then one … DOLLARS line per service class in your store, such as BRAKE DOLLARS, with the parts and labor sold in that class. Under the table, # of Cars Carried Over and $ of Cars Carried Over are the open draft invoices in the store and their value, whatever their date, so you can see the work still to be finished and billed. The four small tables DAILY REFERRALS and WEEKLY REFERRALS (each referral source with the QTY of finalized invoices that named it, most first) and DAILY ZIP CODES and WEEKLY ZIP CODES (each ZIP code on those invoices with its QTY) show where the customers came from for the day and the week.

List of Invoices with Low Gross Profit on Outside Parts Purchases lists, for the week to date rather than the single day, every finalized invoice that had a part bought outside where the net sale was under four times the parts cost and the gross profit on the outside parts came to less than 75 percent of the sale. Each line shows the INVOICE NO., INVOICE DATE, FINALIZED DATE, the PART DESCRIPTION and PART NUMBER as written on the outside part purchase in Expenses, the NET SALE, the GROSS PROFIT (net sale less what was paid for the outside parts), GP %, the OPP paid, and NET/OPP, how many times the parts cost the sale came to. The TOTAL row sums the sale, profit and OPP columns and gives the overall percentage and ratio. A line here means the job was priced too close to the cost of the part; use it to talk to the counter about markup on outside parts.

The Add To Favorites switch beside the heading saves the report under Favorites on the Reports page. Which reports you see depends on your admin group permissions.
People also ask

  • asked 1×

Ask AI