ARM Help

Vital Statistics (Finalized) Report

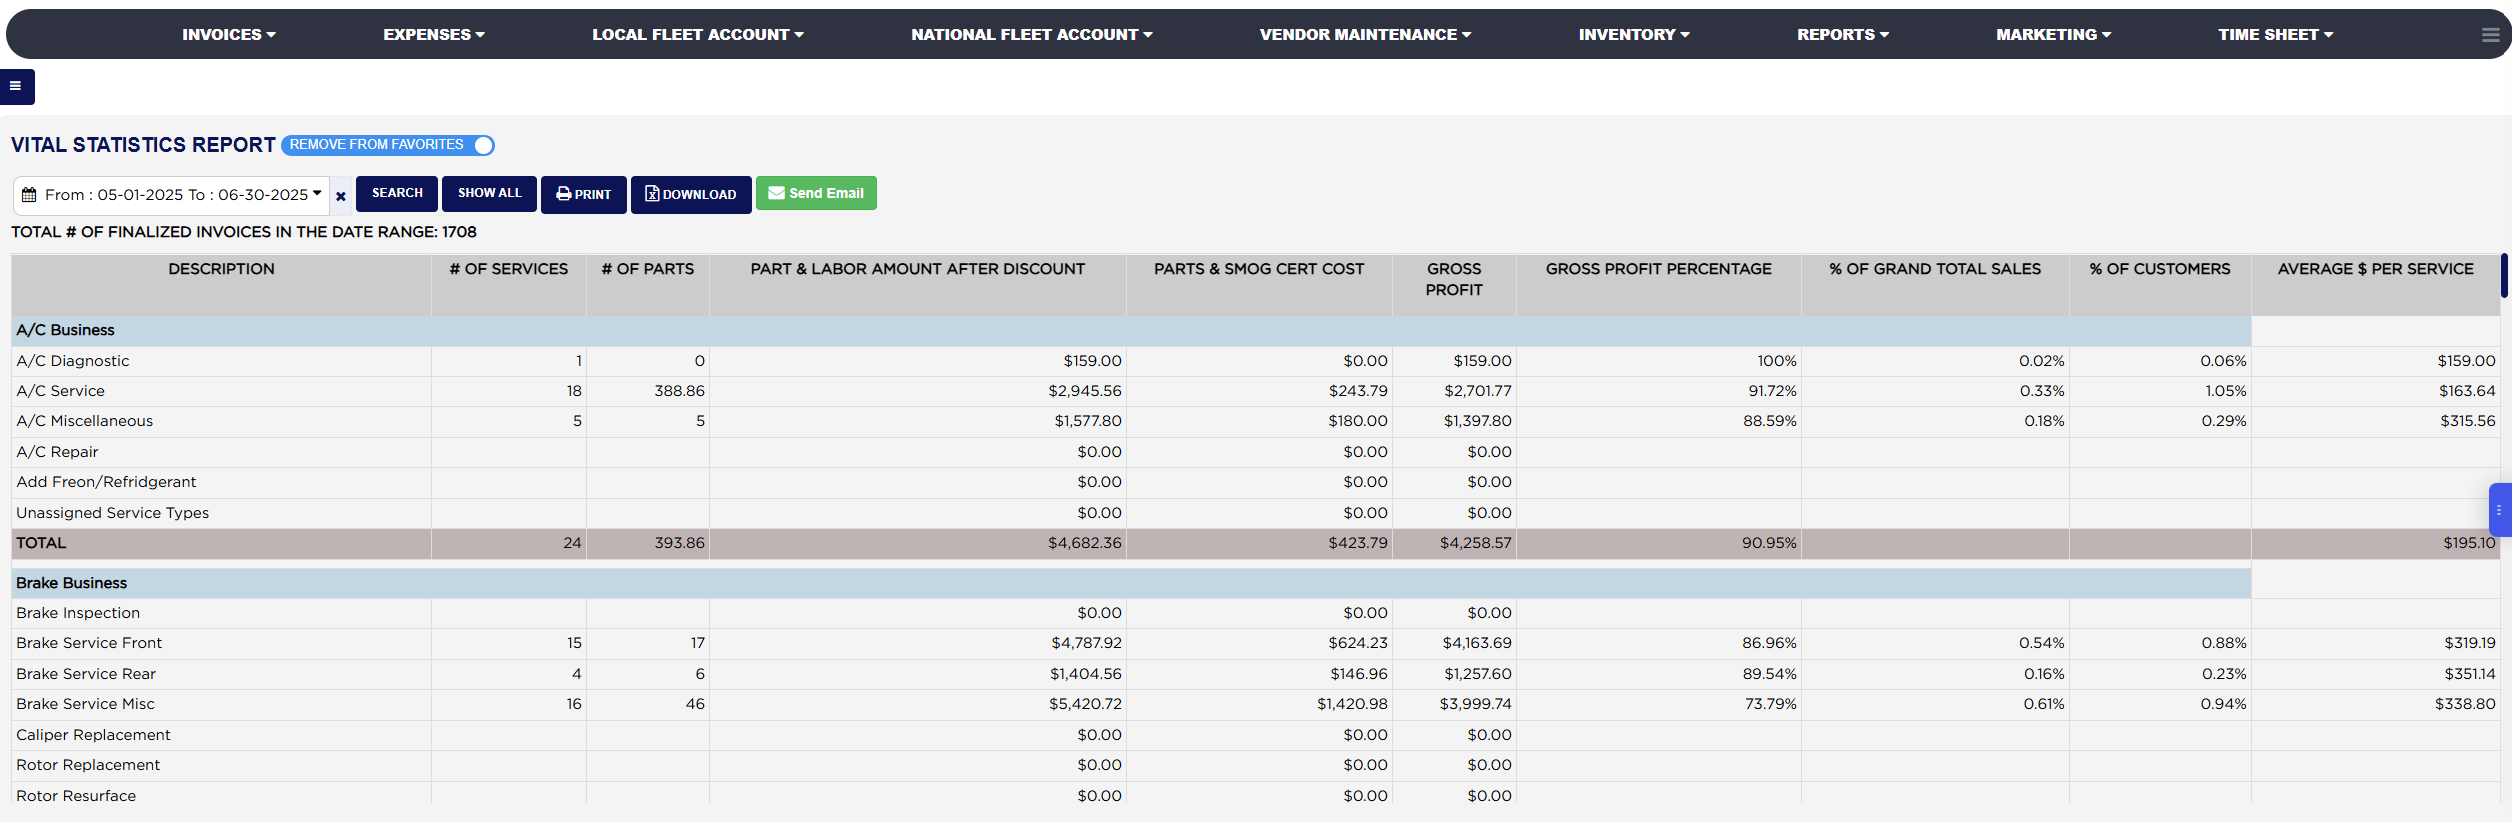
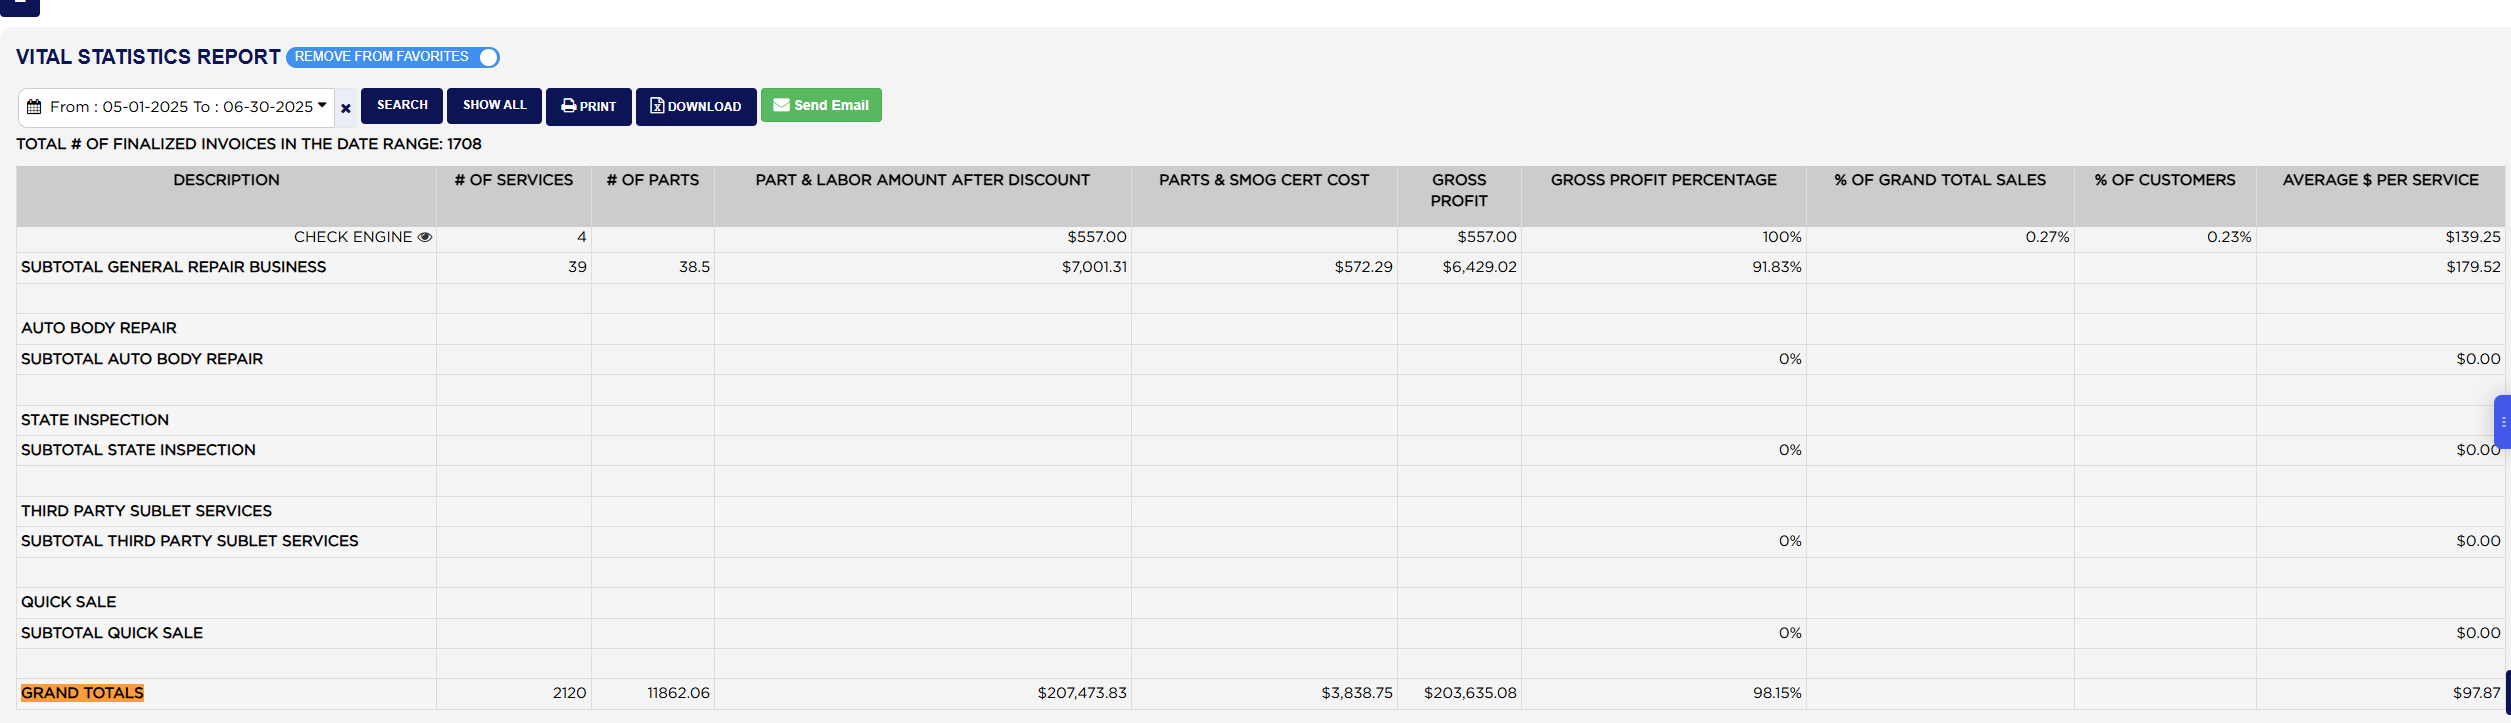
The Vital Statistics (Finalized) Report (its heading reads VITAL STATISTICS REPORT) breaks the finalized invoices of a date range down by what was sold: first by business type and service type, then by service and package, with the number of jobs, the parts sold, the part and labor dollars, the parts cost, the gross profit and its percentage, the share of sales and of customers, and the average ticket per service. Under the tables a SUMMARY gives the car count, ticket average, e-mail and phone capture and the average service time, and a royalties calculation walks from gross sales down to the sales subject to royalties and marketing fees. It is the report a franchise or multi-store owner reads to see the mix of work, and a single shop reads to see which services make the money. Use it to compare business lines, to check e-mail and phone capture at the counter, and to report the royalty base for the period.

6 how-to answers 7 screenshots Open in ARM Markdown

How do I run the Vital Statistics (Finalized) Report? #

  1. From the Home Screen, click Reports → Management & Operational Reports → Vital Statistics (Finalized) Report.
  2. Click the From : … To : … date box and pick the first and last day of the period; the report counts invoices by their finalized date. It opens on today only. The shortcuts on the left of the calendar, Yesterday, This Week, Last Month and the rest, set both dates at once, and clicking Apply runs the report. The × beside the box clears the dates.
  3. Click Search to load the report, or Show All to return to today. The line TOTAL # OF FINALIZED INVOICES IN THE DATE RANGE above the table is the car count every percentage of customers is measured against.
  4. Click Print for a PDF copy in a new tab, Download to save the tables as a spreadsheet file, or Send Email to e-mail the PDF. The three buttons appear only when the range has finalized invoices.

How do I see how a package's figures were calculated? #

  1. From the Home Screen, click Reports → Management & Operational Reports → Vital Statistics (Finalized) Report, and run the report for your date range.
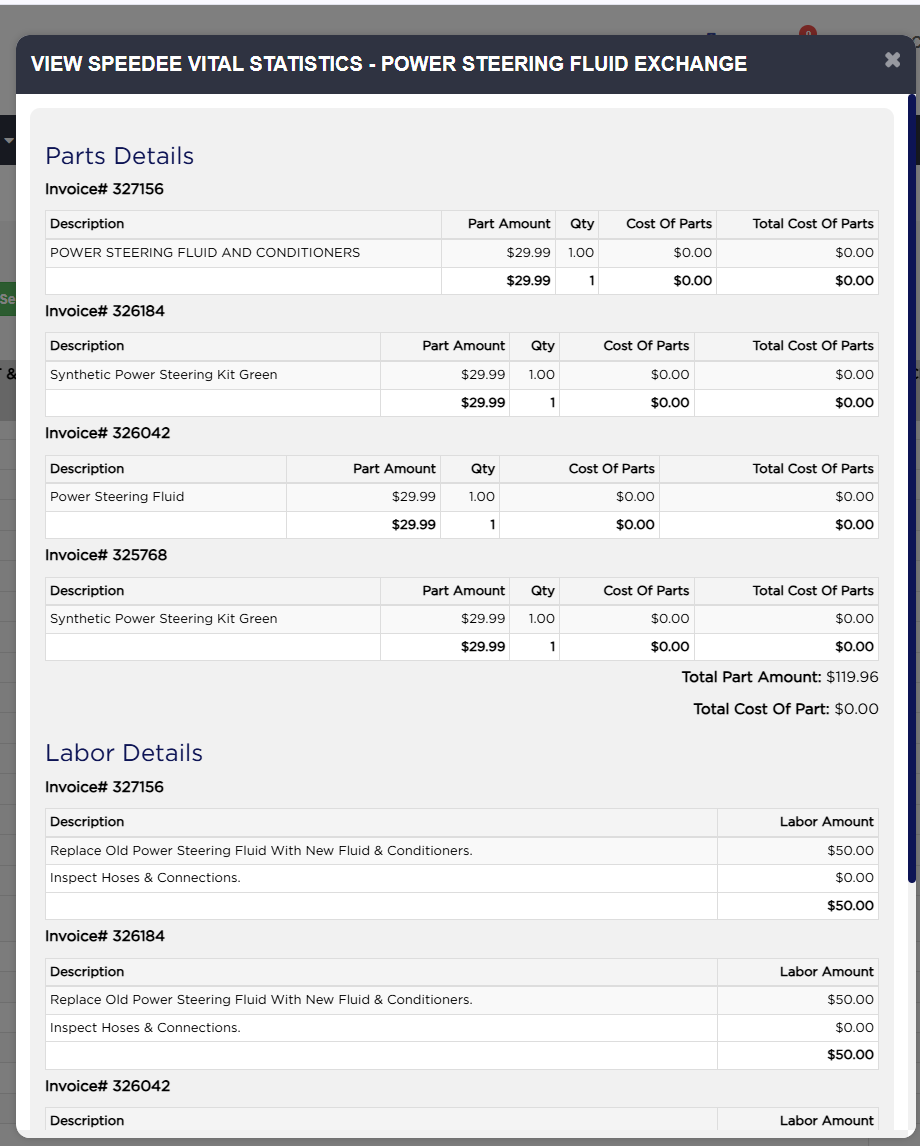
  2. In the service and package section, click the eye icon (View Calculation) after the package name. The VIEW SPEEDEE VITAL STATISTICS popup opens for that package.
  3. Under Parts Details each invoice is listed by Invoice# with its part lines: Description, Part Amount, Qty, Cost Of Parts and Total Cost Of Parts, followed by Total Part Amount: and Total Cost Of Part:. Under Labor Details each invoice shows its labor lines with Description and Labor Amount, followed by Total Labor Amount:. Close the popup with the × in its corner.
VIEW SPEEDEE VITAL STATISTICS popup with Parts Details and Labor Details

How do I e-mail the report? #

  1. From the Home Screen, click Reports → Management & Operational Reports → Vital Statistics (Finalized) Report, and run the report for your date range.
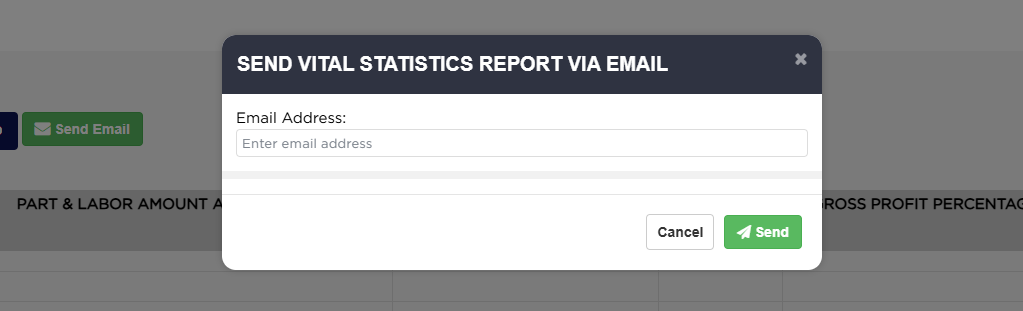
  2. Click Send Email. In the Send Vital Statistics Report via Email popup, type the recipient into Email Address: and click Send; Cancel closes the popup without sending.
  3. The PDF of the report for the same dates is sent from the store's e-mail address with the subject Vital Statistics Report and the store name, and Email sent successfully! confirms it. If the address is missing or not valid the popup says so; if sending fails, the message starts with Failed to send email.
Send Vital Statistics Report via Email popup

How do I get the period's royalty base? #

  1. From the Home Screen, click Reports → Management & Operational Reports → Vital Statistics (Finalized) Report.
  2. Set From : … To : … to the first and last day of the period and click Search.
  3. Read EQUALS TOTAL SALES SUBJECT TO ROYALTIES AND MARKETING; if a SALES INVOICES NET OF REFUND INVOICES table is shown, take the figure from there. Click Print or Send Email to pass it on.

How do I work out the ten columns on a service or package line? #

  1. From the Home Screen, click Reports → Management & Operational Reports → Vital Statistics (Finalized) Report, run it for your date range and pick one package line in the service and package section. The printed copy labels the columns with letters, A, I, B, C, D=B-C, E=D/B, F = B/GT OF B, G= A/XXX and H=B/A, which are used below.
  2. # OF SERVICES (A) is the number of finalized invoices in the range on which the package had a part line or a labor line. Example: 20. # OF PARTS (I) is the quantity of parts sold on those lines. Example: 40.
  3. PART & LABOR AMOUNT AFTER DISCOUNT (B) is the part charges plus the labor charges of those lines. Example: $3,000.00.
  4. PARTS & SMOG CERT COST (C) is what the parts cost the shop, part by part: the cost entered on the outside part purchase in Expenses when the part was bought for the job, otherwise the cost of the stock lots it was drawn from. Example: $1,000.00.
  5. GROSS PROFIT (D) is B − C: $3,000.00 − $1,000.00 = $2,000.00. GROSS PROFIT PERCENTAGE (E) is D ÷ B × 100: 66.67%.
  6. % OF GRAND TOTAL SALES (F) is B divided by the GRAND TOTALS amount of all packages, times 100. Example: $3,000.00 ÷ $30,000.00 × 100 = 10.00%. In the business type section the same column measures the line against the gross sales and tax of the invoices it appears on, so the two sections do not add up the same way.
  7. % OF CUSTOMERS (G) is A divided by the car count shown in TOTAL # OF FINALIZED INVOICES IN THE DATE RANGE, times 100. Example: 20 ÷ 100 × 100 = 20.00%.
  8. AVERAGE $ PER SERVICE (H) is B ÷ A: $3,000.00 ÷ 20 = $150.00.
  9. The SUBTOTAL and GRAND TOTALS lines add A, I, B, C and D and work E and H from those totals; F and G are left blank on them.
Vital Statistics (Finalized) Report business type and service type section
Vital Statistics (Finalized) Report service and package section with SUBTOTAL and GRAND TOTALS
Vital Statistics (Finalized) Report one package line used in the ten column example

How do I follow the royalties calculation? #

  1. From the Home Screen, click Reports → Management & Operational Reports → Vital Statistics (Finalized) Report, run it for the period and go to the royalties table under SUMMARY.
  2. Start from TOTAL GROSS SALES, the gross sales of every invoice finalized in the range. Example: $50,000.00.
  3. Subtract in turn each MINUS line: MINUS SALES TAXES (the sales tax on those invoices), MINUS FLEET DISCOUNT ROYALTY REPORT (the co-brand or fleet discount percentage applied to the sales of those customers), the state fee lines MINUS STATE TIRE FEES and MINUS STATE BATTERY FEES, the certificate lines MINUS COST OF SMOG CERTS USED, MINUS COST OF STATE VEHICLE INSPECTION CERT USED, MINUS COST OF BRAKE AND LAMP INSPECTION CERT USED and MINUS COST OF VEHICLE STATE SAFETY INSPECTION CERT USED, and the pass-through lines MINUS ACTUAL COST OF TOWING BILLED TO CUST, MINUS ACTUAL COST OF RENTAL CAR BILLED TO CUST and MINUS ROAD HAZARD INSURANCE SALES, which are the parts and labor sold under the towing, rental car and road hazard service types.
  4. GIFT CERTIFICATE SOLD(INFO PURPOSES ONLY) is shown but not subtracted.
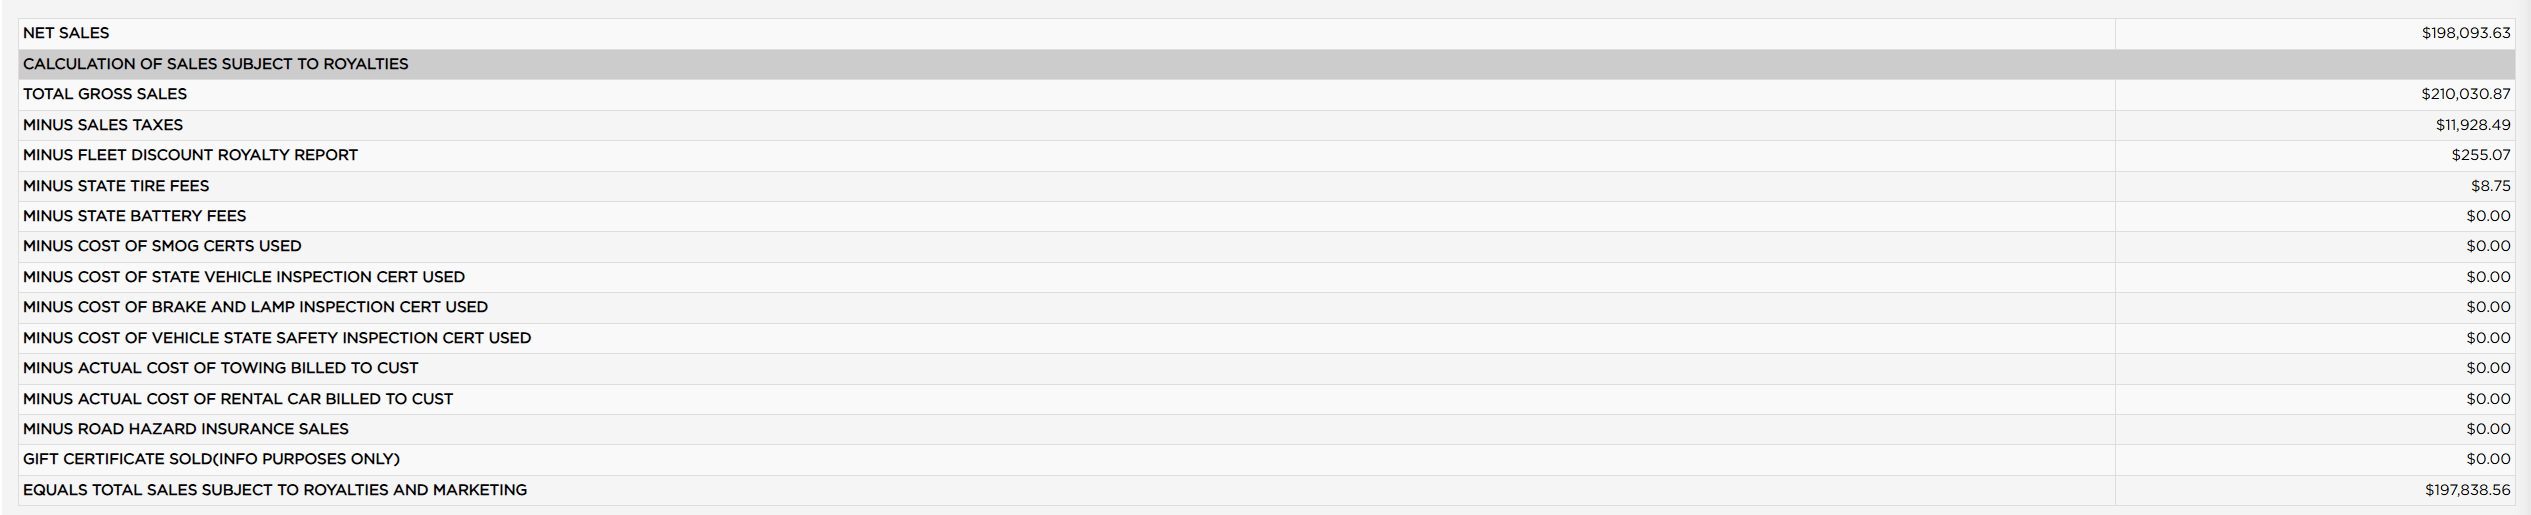
  5. EQUALS TOTAL SALES SUBJECT TO ROYALTIES AND MARKETING is what is left. Example: $50,000.00 − $4,000.00 tax − $500.00 fleet discount − $300.00 fees − $200.00 certificates − $400.00 towing, rental and road hazard = $44,600.00.
  6. If a red REFUND INVOICES table is shown, the same steps are worked over the invoices refunded in the range, and SALES INVOICES NET OF REFUND INVOICES subtracts that table from this one line by line; its EQUALS line is the figure to report.
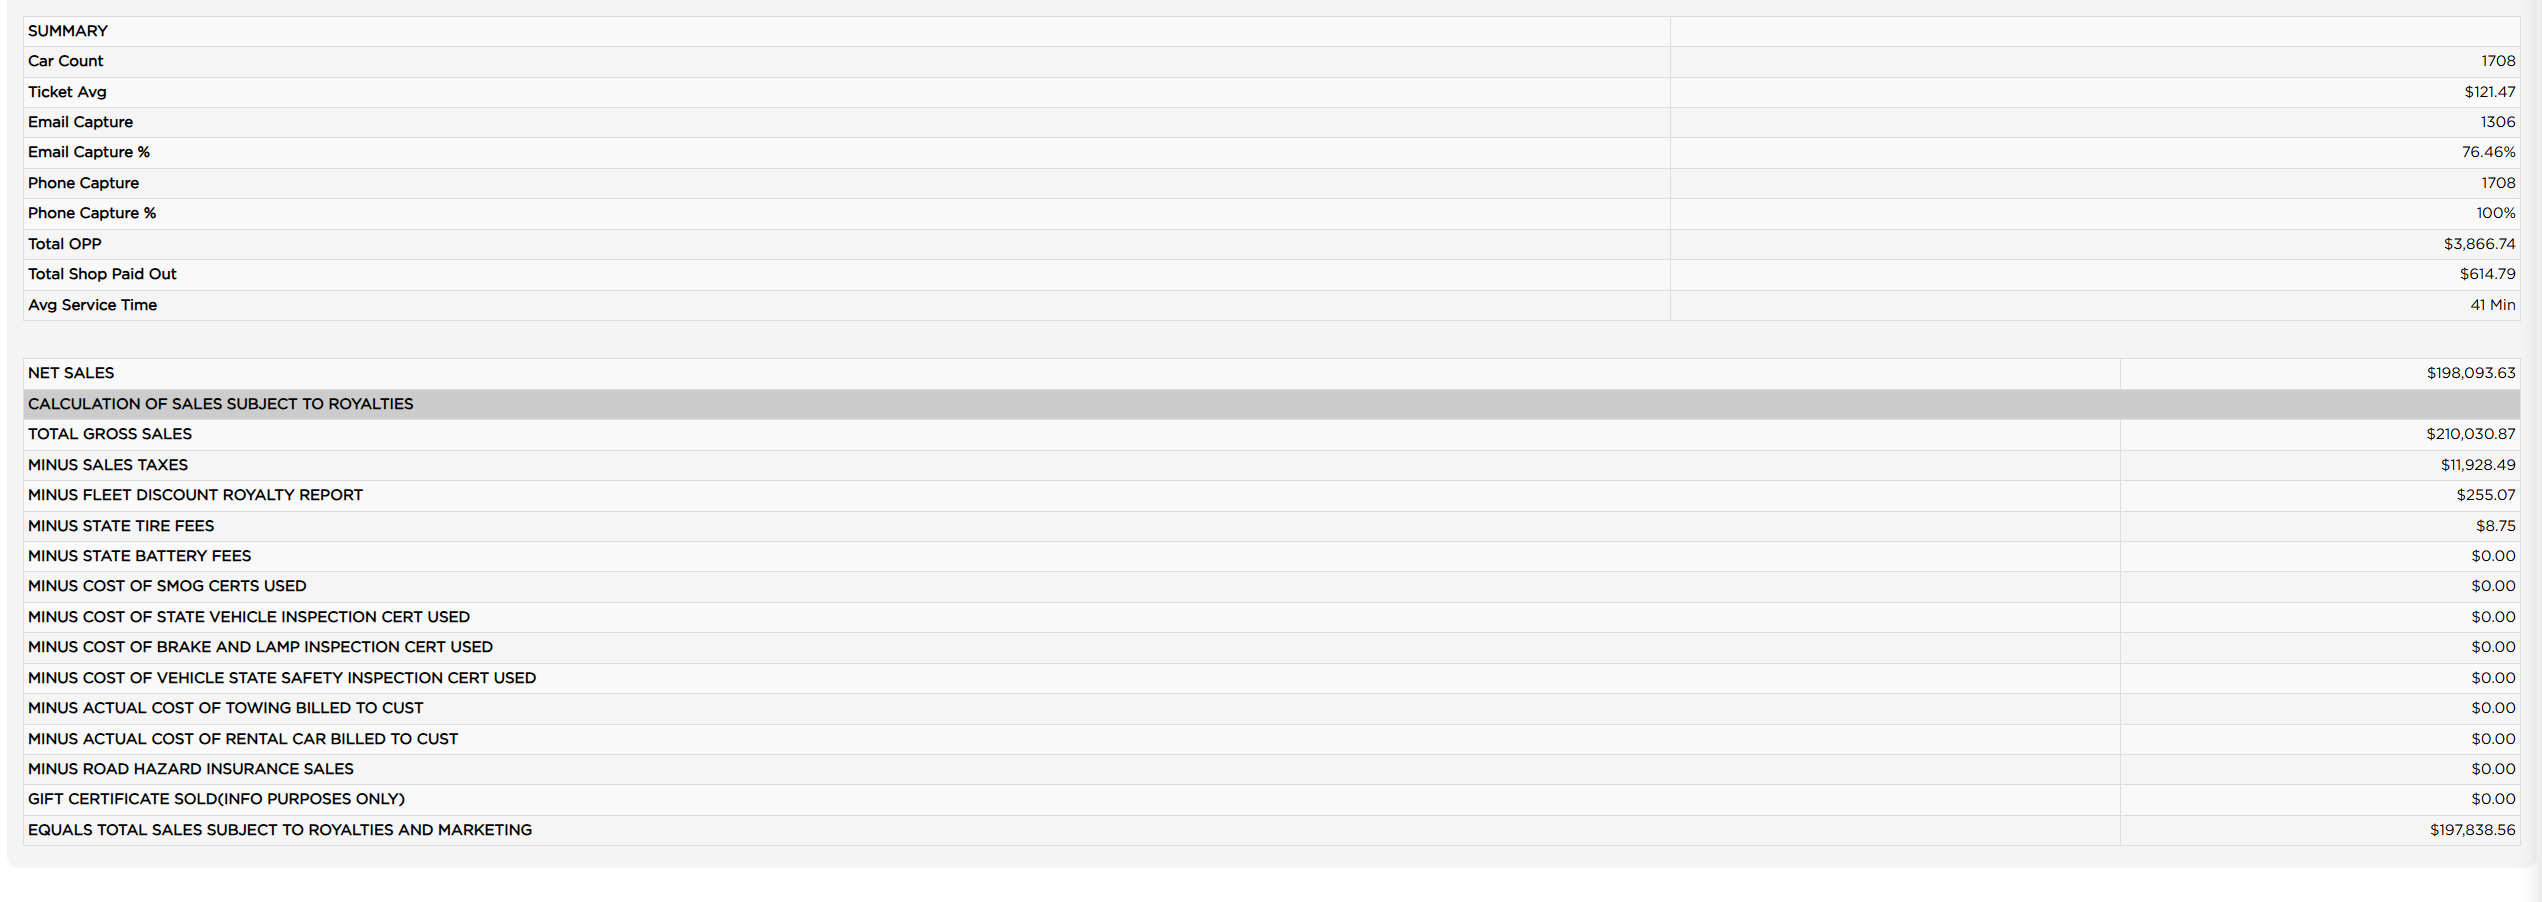
Vital Statistics (Finalized) Report SUMMARY and royalties tables
Vital Statistics (Finalized) Report royalties table lines used in the example
About this screen

The first section groups the sales under the business types A/C Business, Brake Business, Fast Lube Business, General Repair Business, State Inspection, Tire & Alignment Business, Tune Up Business and Unassigned Business Type, with one line per service type inside each and an Unassigned Service Types line for packages with no type. Each line shows the DESCRIPTION, # OF SERVICES (the number of invoices with that work on them), # OF PARTS sold, PART & LABOR AMOUNT AFTER DISCOUNT, PARTS & SMOG CERT COST (what the parts cost the shop, from the stock they were drawn from or the outside purchase recorded in Expenses), GROSS PROFIT (the amount less the cost), GROSS PROFIT PERCENTAGE, % OF GRAND TOTAL SALES, % OF CUSTOMERS (the number of services as a share of the finalized invoices in the range) and AVERAGE $ PER SERVICE (the amount divided by the number of services). Fast Lube Business has an All Oil Change line that sums its oil change service types. Each business type ends with a TOTAL line, and the section ends with GRAND TOTALS. Refunded invoices are left out of these lines when the refund fell inside the range.

The second section lists every service in the store in capitals, such as BRAKES, with a line for each of its packages that was sold in the range, using the same ten columns; here % OF GRAND TOTAL SALES is the package's share of the part and labor dollars of all packages. Each service ends with a SUBTOTAL line and the section with GRAND TOTALS. Packages that were not sold in the range are not listed. The eye icon after a package name opens its calculation (below).

SUMMARY shows the Car Count (finalized invoices in the range), the Ticket Avg (the part and labor dollars of all packages divided by the car count), Email Capture and Email Capture % (the invoices whose customer has an e-mail address on file, as a count and as a share of the car count), Phone Capture and Phone Capture % in the same way, Total OPP (outside part purchases entered in Expenses in the range), Total Shop Paid Out (shop paid-outs in the range) and Avg Service Time in minutes from the invoice timers. The royalties table starts from NET SALES and, under CALCULATION OF SALES SUBJECT TO ROYALTIES, takes TOTAL GROSS SALES and subtracts MINUS SALES TAXES, MINUS FLEET DISCOUNT ROYALTY REPORT (the co-brand or fleet discount given to those customers), MINUS STATE TIRE FEES, MINUS STATE BATTERY FEES, MINUS COST OF SMOG CERTS USED, MINUS COST OF STATE VEHICLE INSPECTION CERT USED, MINUS COST OF BRAKE AND LAMP INSPECTION CERT USED, MINUS COST OF VEHICLE STATE SAFETY INSPECTION CERT USED, MINUS ACTUAL COST OF TOWING BILLED TO CUST, MINUS ACTUAL COST OF RENTAL CAR BILLED TO CUST and MINUS ROAD HAZARD INSURANCE SALES, shows GIFT CERTIFICATE SOLD(INFO PURPOSES ONLY) without subtracting it, and arrives at EQUALS TOTAL SALES SUBJECT TO ROYALTIES AND MARKETING. When invoices were refunded in the range, a red REFUND INVOICES table repeats the same lines for the refunds and a SALES INVOICES NET OF REFUND INVOICES table shows the difference, which is the figure to report.

Download saves the business type, service and royalties tables as they appear on the screen to a file named vital_statistics_report.csv; the SUMMARY table is not included. The Add To Favorites switch beside the heading saves the report under Favorites on the Reports page. Which reports you see depends on your admin group permissions.
People also ask

  • asked 1×

Ask AI