Keep the range short. The table is six fixed columns plus one for every business type you have — seventeen extra columns on the example store — so it scrolls a long way sideways. A week or two of invoices is far easier to read than a month.
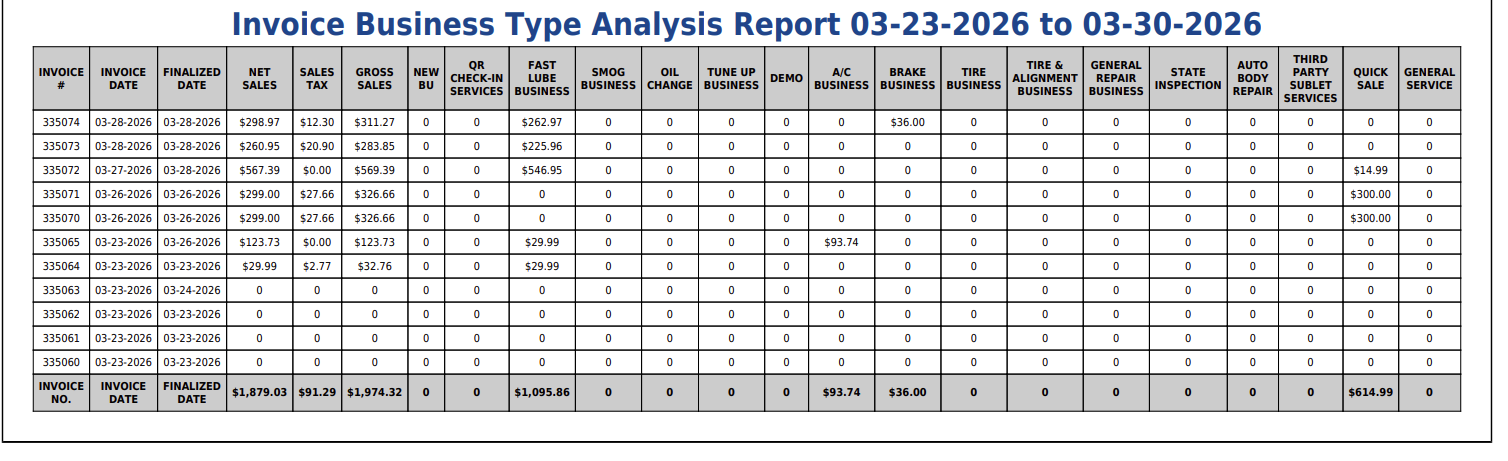
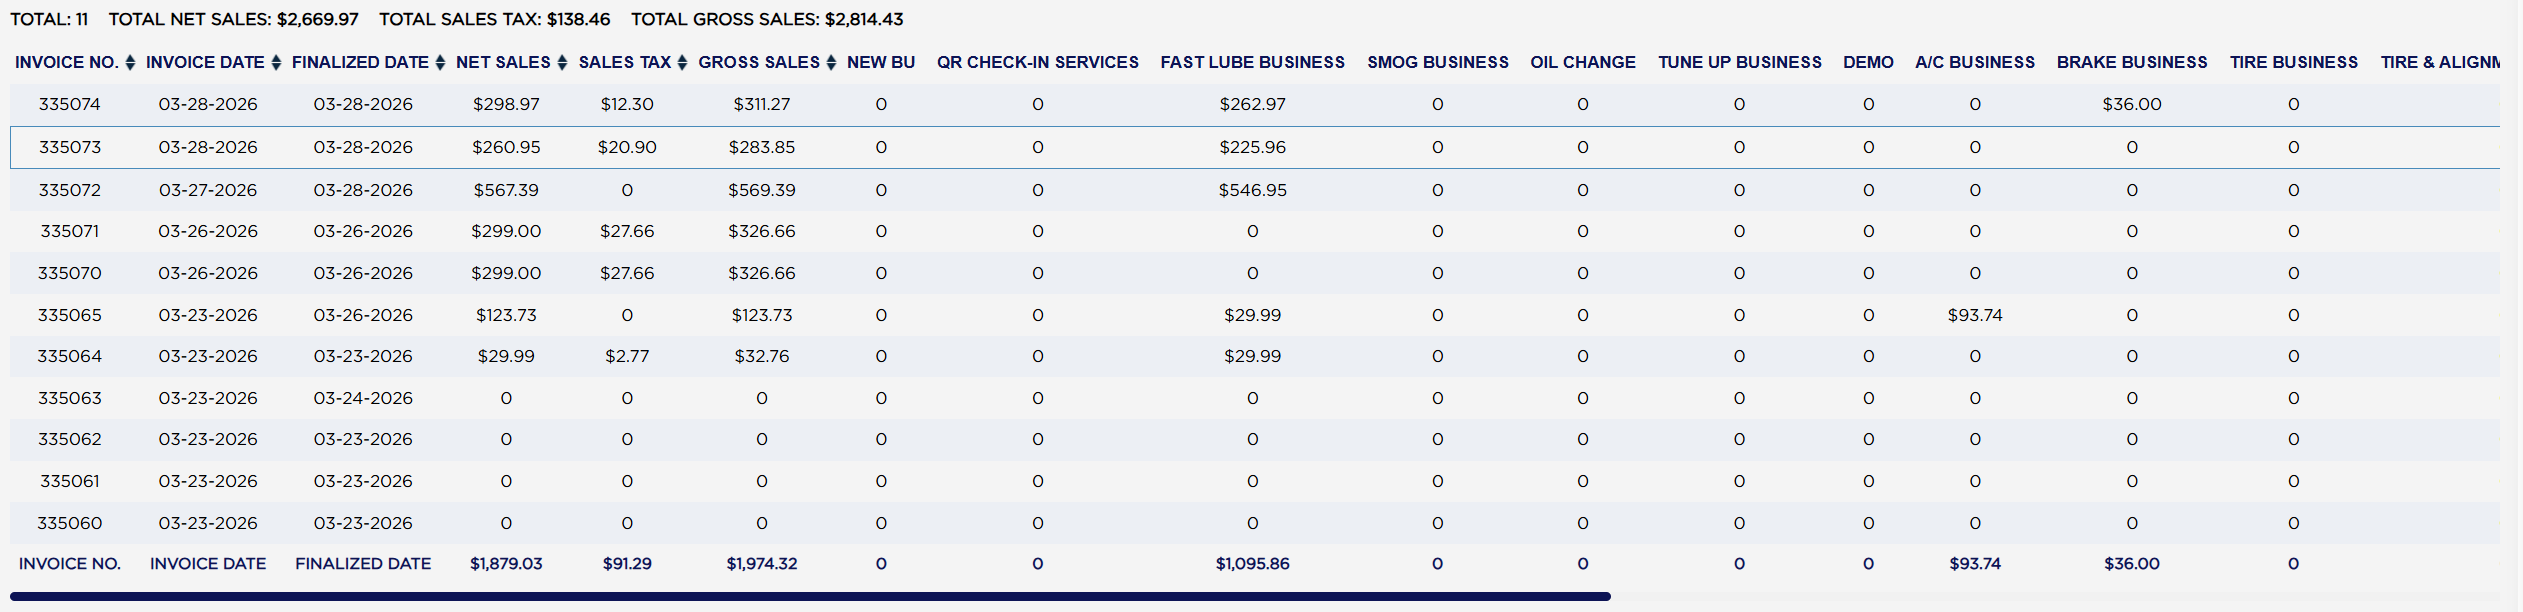
The first six columns are the same for every invoice: the INVOICE NO., the INVOICE DATE it was raised, the FINALIZED DATE it was closed, the NET SALES, the SALES TAX and the GROSS SALES. Everything after that is one column per business type, holding what that invoice came to for that type. A zero prints as a plain `0` rather than `$0.00`, so a row of zeros with one figure in it is an invoice that was entirely one kind of work.
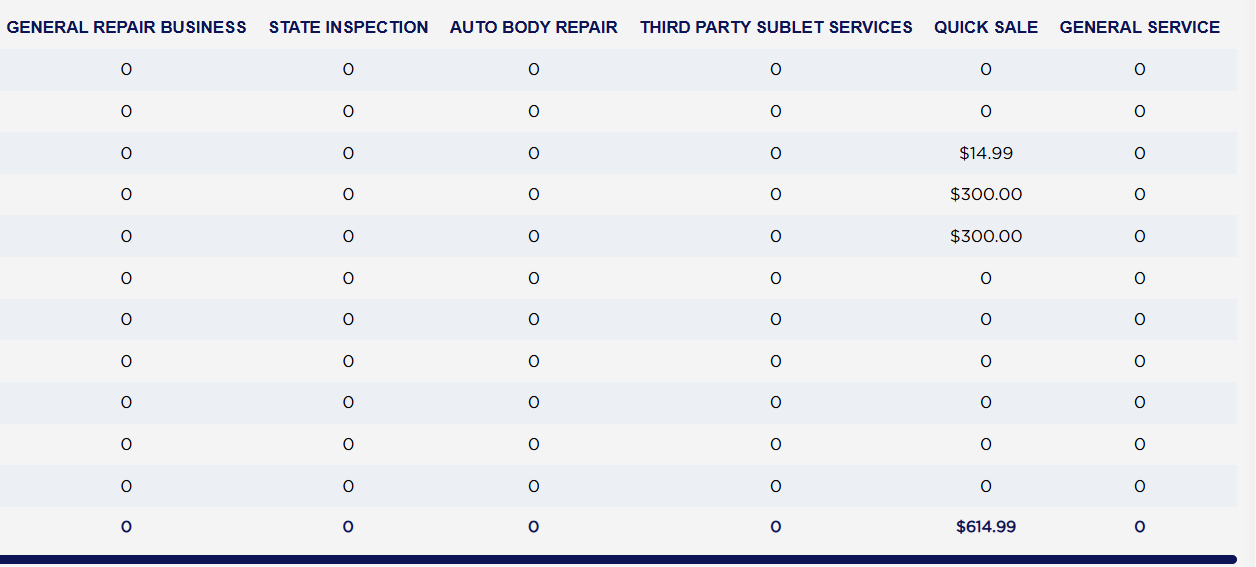
Scroll right to reach the remaining business types. The footer runs the whole width: it repeats INVOICE NO., INVOICE DATE and FINALIZED DATE as words, then totals every money column, including each business type.
Read the totals from the footer of the table, not from the line above it. The two do not agree, and the footer is the one that matches the invoices in front of you. In the example the line above reads `TOTAL NET SALES: $2,669.97` while the footer of the same eleven rows totals `$1,879.03`. The line above is counting a wider set of invoices, including ones that were never finalized, and dating them differently — so on a report about finalized invoices it is the figure least worth quoting.
Invoices that were finalized without any sales on them still appear, with zeros across every column — they are usually jobs closed with no charge rather than a fault. Where the report runs to more than one page, the footer totals only the page you are looking at, so use the printout when you need the figures for a whole period. The ADD TO FAVORITES switch beside the report title saves a shortcut to the report under your favourites in the main Reports menu.