ARM Help

Fleet Car Count & Dollar Analysis Report

Fleet Car Count & Dollar Analysis Report answers one question: how much of your business is fleet work. It sets your local fleets and your national fleets against all your customers over a date range, showing what each brought in, how many cars it accounted for, and what the average ticket was. From there you can open either group and see the individual accounts behind it. Use it to see whether fleet work is worth the terms you give it, to compare a fleet average ticket against the shop as a whole, and to find which accounts are carrying the fleet side.

3 how-to answers 5 screenshots Open in ARM Markdown

How do I run the Fleet Car Count & Dollar Analysis Report? #

  1. From the Home Screen, click Reports → Fleet & Customer Reports → Fleet Car Count & Dollar Analysis Report.
  2. Click the From : … To : … date box and pick the first and last day of the period.
  3. Click SHOW ALL to load the report. There is no Search button on this screen — the date range is the only filter.
  4. Click PRINT for a PDF copy or DOWNLOAD to export to a spreadsheet.
Fleet Car Count and Dollar Analysis date range and buttons
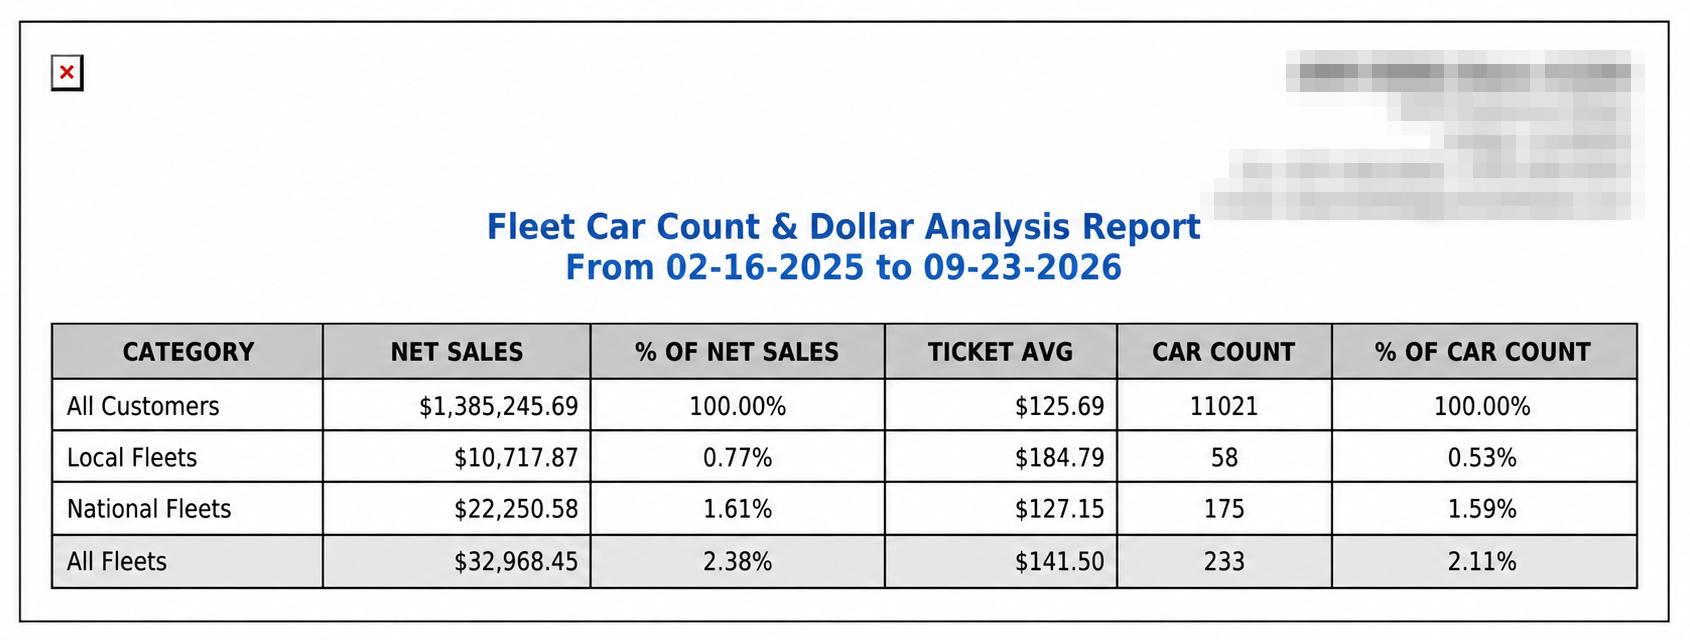
Fleet Car Count and Dollar Analysis category table
Fleet Car Count and Dollar Analysis print output

How do I see the accounts behind a fleet line? #

  1. From the Home Screen, click Reports → Fleet & Customer Reports → Fleet Car Count & Dollar Analysis Report, and run it for your date range.
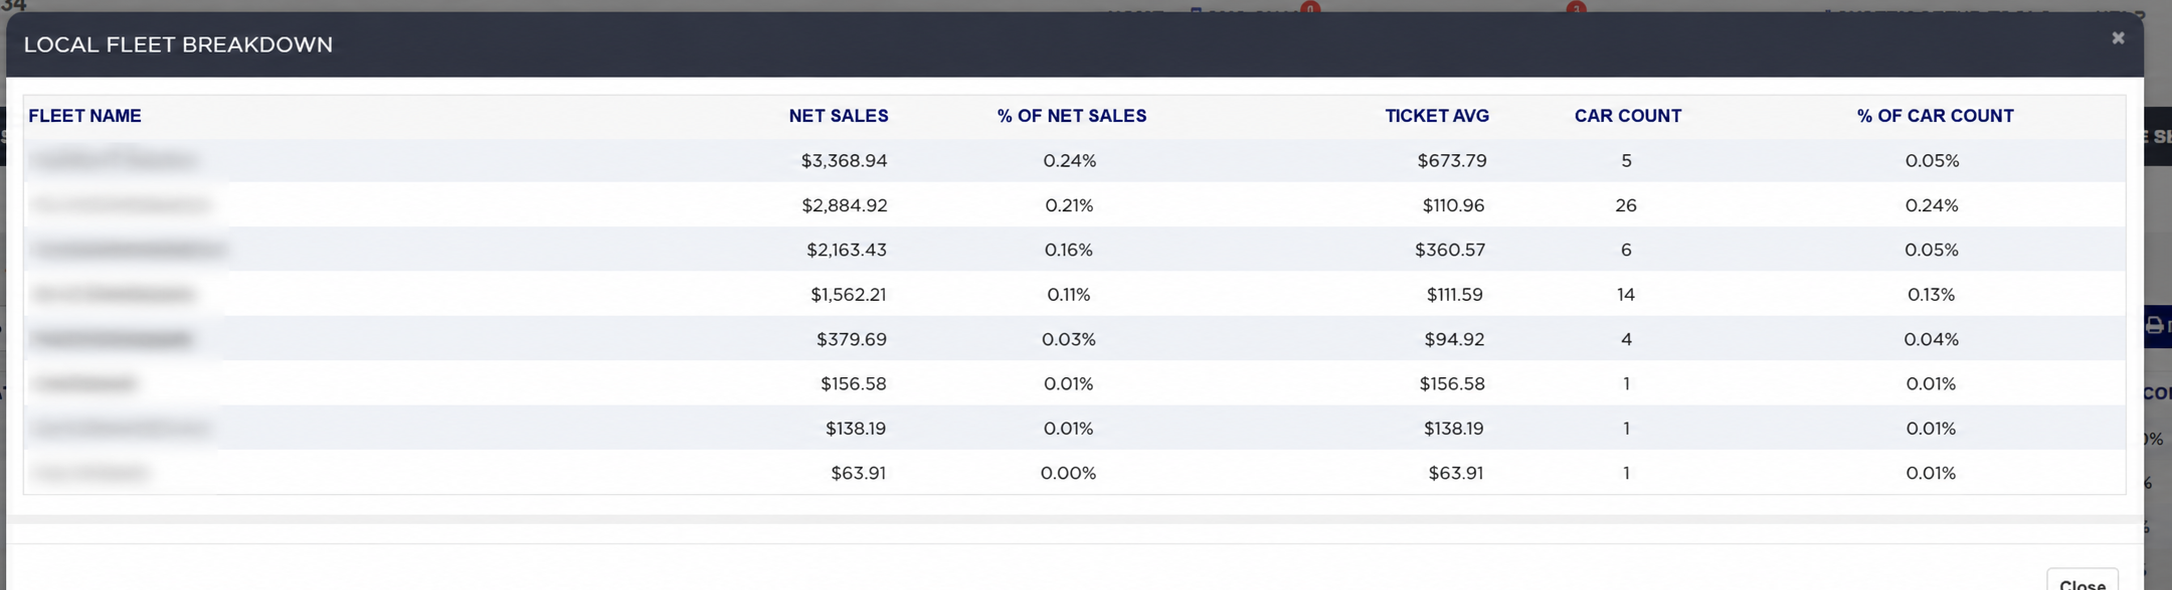
  2. Click the small eye icon beside Local Fleets. The Local Fleet Breakdown box lists each local fleet account with the same six figures — FLEET NAME, NET SALES, % OF NET SALES, TICKET AVG, CAR COUNT and % OF CAR COUNT.
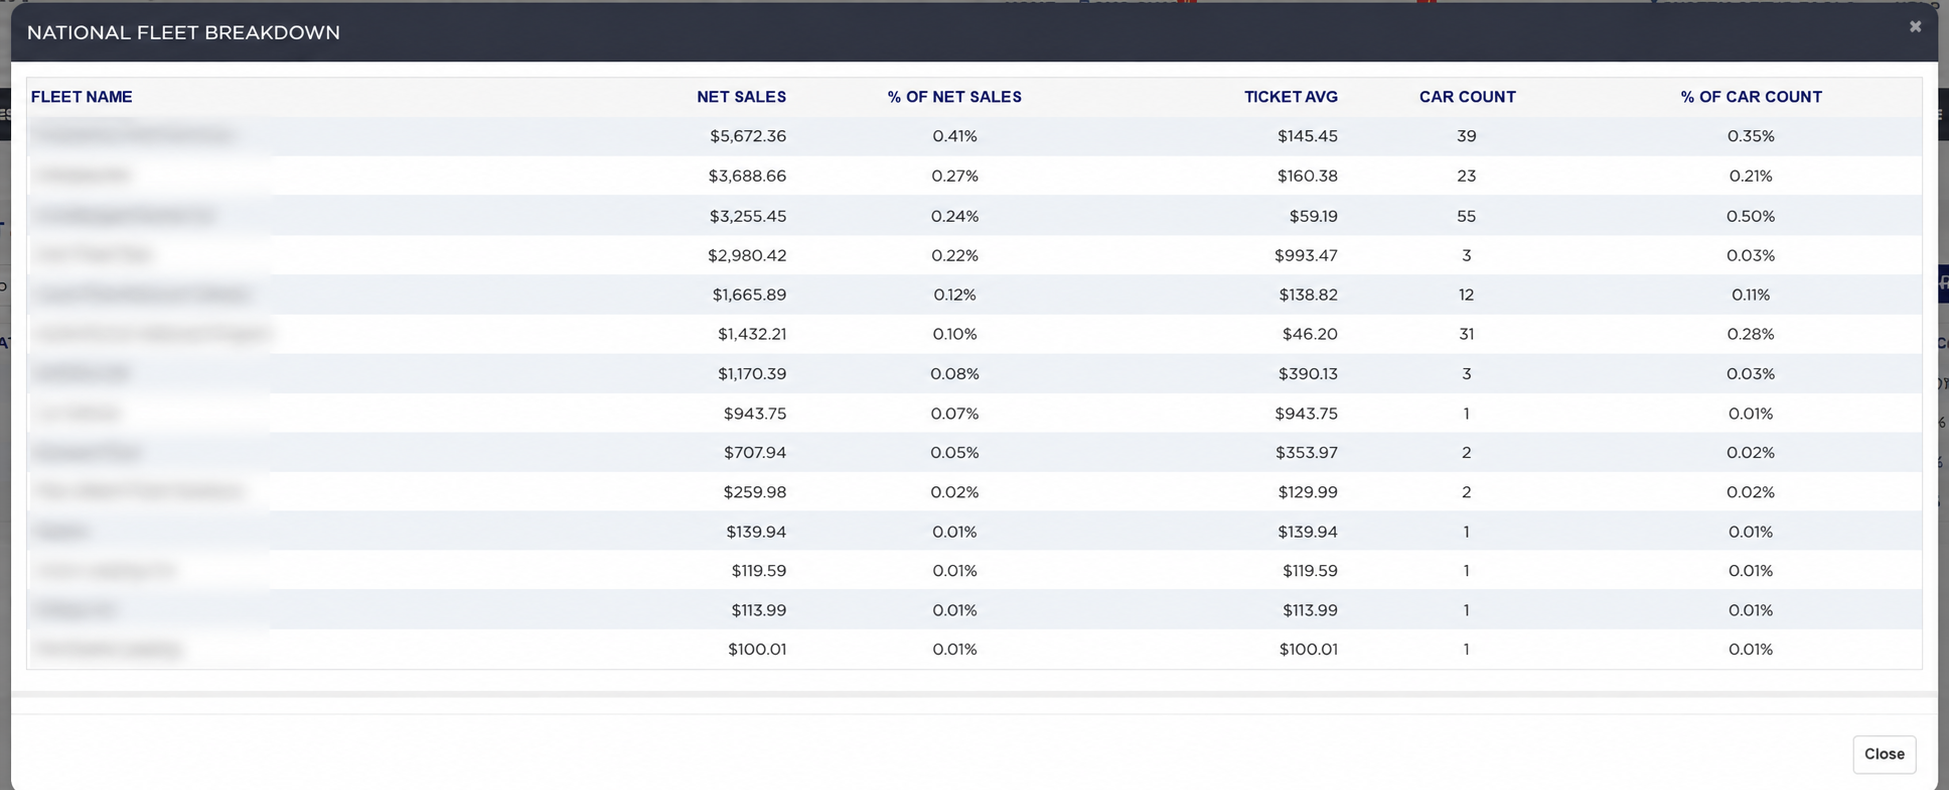
  3. Click the eye icon beside National Fleets for the National Fleet Breakdown, which does the same for the national accounts.
  4. Click Close to go back to the report. The percentages inside both boxes are still worked out against All Customers, not against the fleet group, so an account showing 0.24% brought in that share of your whole business.
Local Fleet Breakdown popup
National Fleet Breakdown popup

How do I work out the ticket average and the percentages on one line? #

  1. From the Home Screen, click Reports → Fleet & Customer Reports → Fleet Car Count & Dollar Analysis Report, run it for your date range and pick one line.
  2. NET SALES is what that group brought in over the period. Example: Local Fleets at $10,717.87.
  3. CAR COUNT is how many cars that group accounted for. Example: 58.
  4. TICKET AVG is net sales divided by car count: $10,717.87 ÷ 58 = $184.79. That is the average sale, and comparing it with the All Customers ticket average — $125.69 in the same period — shows whether fleet work is worth more or less per car than your ordinary business.
  5. % OF NET SALES is that line's net sales divided by the All Customers net sales: $10,717.87 ÷ $1,385,245.69 × 100 = 0.77%.
  6. % OF CAR COUNT works the same way on the car counts: 58 ÷ 11021 × 100 = 0.53%.
  7. All Fleets is Local Fleets plus National Fleets, on both measures: $10,717.87 + $22,250.58 = $32,968.45, and 58 + 175 = 233. Its own ticket average is worked out from those totals, not by averaging the two lines above: $32,968.45 ÷ 233 = $141.50.
About this screen

The table has four lines. All Customers is your whole business for the period and is the line everything else is measured against. Local Fleets and National Fleets are the two kinds of fleet account, and All Fleets is the two of them added together. Across each line: NET SALES is what that group brought in, % OF NET SALES is that as a share of the All Customers figure, TICKET AVG is the average sale, CAR COUNT is how many cars went through, and % OF CAR COUNT is that as a share of all the cars.

Reading the two percentage columns together is what makes this report useful. Where the share of net sales is higher than the share of car count, that group is bringing in more per car than the shop average; where it is lower, the work is cheaper per car and you are giving up margin for the volume.

The ADD TO FAVORITES switch beside the report title saves a shortcut to the report under your favourites in the main Reports menu.


Ask AI