Switching mode does not re-run the report. The two buttons only change which date control you can see; the figures underneath stay exactly as they were until you pick a date. If you click across and read the table straight away, you are still looking at the previous mode's result. Always choose a date after switching, and check that WEEK END/CUSTOM DATE shows what you expect before trusting the row.
Do not pick a date earlier than your store's first day in ARM. This report does not quietly move it forward — it sends you out to the welcome screen with a permission error. The date picker normally prevents it, but the box also accepts typing.
The row begins with CITY and STATE. Then come three blocks under a second row of headings: PRESENT YEAR AMOUNTS, PRIOR YEAR AMOUNTS and % CHANGE, followed by a WEEKLY block of cars-per-day figures.
PRESENT YEAR AMOUNTS and PRIOR YEAR AMOUNTS each give four columns — WEEK END/CUSTOM DATE, NET SALES, CAR COUNT and TICKET AVERAGE. In the example the period 06-01-2026 to 08-31-2026 took $5,541.85 from 12 cars at $461.82 each, against $300,790.93 from 2,593 cars at $116.00 in the same three months of 2025.
NET SALES here is your gross sales with the sales tax taken out. Refunds are not deducted from it. If refunds matter to the period you are looking at, use Prior Year Comparison After Refund Report, which adds a Net Refund Sales and a Net Final Sales column.
TICKET AVERAGE is that column divided by CAR COUNT — $5,541.85 ÷ 12 = $461.82 this year, $300,790.93 ÷ 2,593 = $116.00 last.
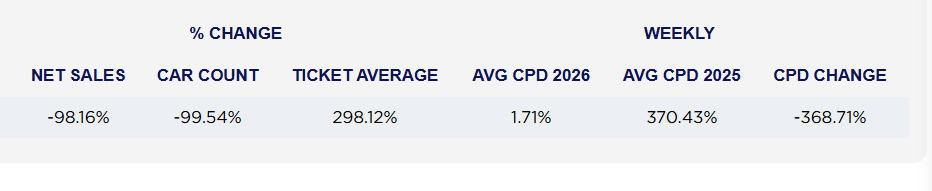
The three % CHANGE columns — NET SALES, CAR COUNT and TICKET AVERAGE — each divide this year by last year and subtract one. In the example they read −98.16%, −99.54% and 298.12%: far fewer cars came in, but each one spent nearly four times as much. Read the three together; any one on its own tells you very little.
In weekly mode the comparison is 52 weeks back, not one calendar year. Pick a Saturday and the prior-year column lands on the Saturday 364 days earlier — one day adrift of the same calendar date. That is deliberate: it lines a full Sunday-to-Saturday trading week up against a full trading week, which a calendar year cannot do. In custom mode ARM uses a true calendar year instead, so the two modes answer slightly different questions.
The last three columns are cars per day, and they need care. AVG CPD 2026, AVG CPD 2025 and CPD CHANGE take each year's car count and divide by the number of days you are open in a *week* — six or seven, depending on whether your store has traded on a Sunday recently.
- They are counts, not percentages, even though each one is printed with a % sign after it. A reading of 1.71% means 1.71 cars, not a percentage of anything.
- CPD CHANGE is a subtraction, not a change. It is this year's figure minus last year's — in the example 1.71 − 370.43 = −368.71 — so it is "368 fewer cars a day", despite sitting beside three columns that really are percentage changes.
- They are only meaningful on a single week. The divisor is always a week's worth of days, however long your period is. In the example the range is 92 days, so AVG CPD 2025 reads 370.43 when the true figure is 2,593 ÷ 92 = 28 cars a day. On any custom range longer than a week, work these out yourself — divide CAR COUNT by the number of days you were open in the period.
If the printed copy disagrees with the screen, trust the screen. The PRINT button produces the same table as a PDF, and the two have not always worked the NET SALES column out the same way. Check one figure against the screen before you send a printout to anybody.
A note on the three reports in this family. Prior Year Comparison Report gives the same comparison without the cars-per-day block. Prior Year Comparison After Refund Report adds what you refunded and what you kept after it. All three are built from the same figures, so the columns they share will agree.