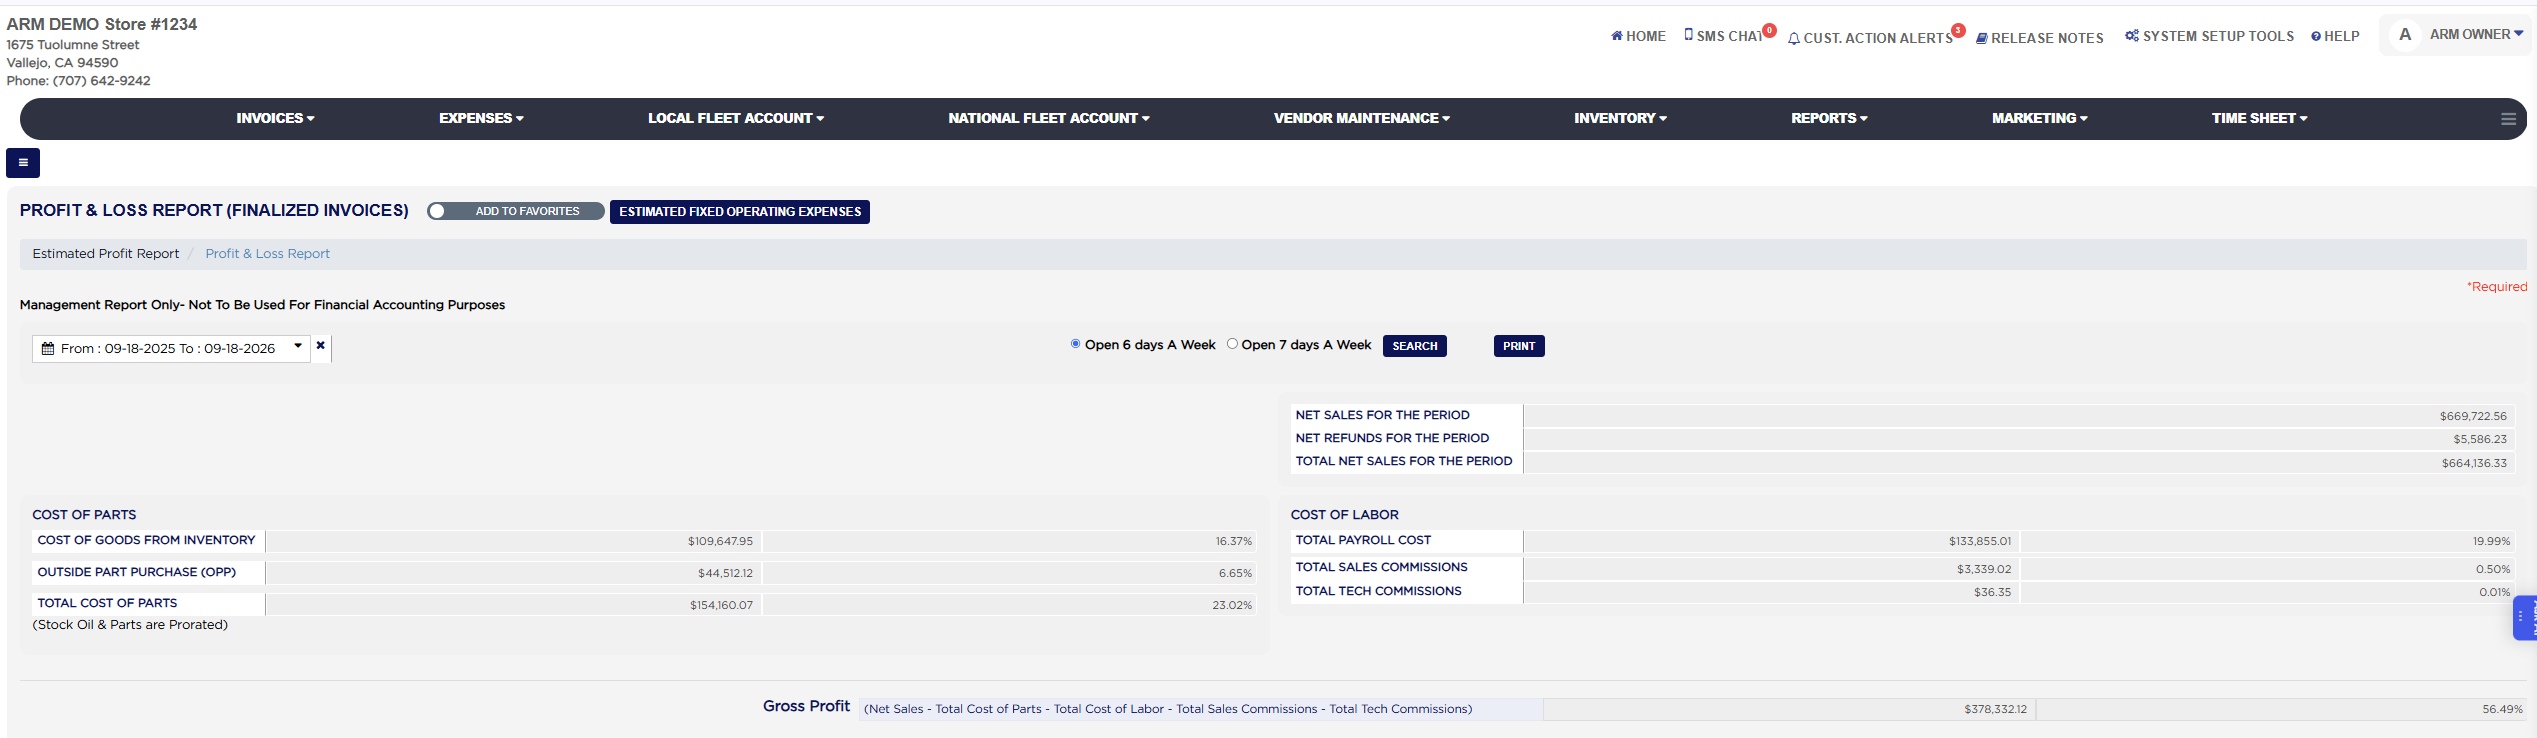
The top right shows the sales for the period: Net Sales for the Period (finalized invoices, before tax and fees), Net Refunds for the Period (refunds given in the range) and Total Net Sales for the Period, which is sales less refunds and is the base every percentage on the page is measured against. Cost of Parts lists Cost of Goods from Inventory, the purchase cost of the parts and oil taken from stock on those invoices (stock oil and stock parts are prorated to the period), Outside Part Purchase (OPP), what was paid for parts bought for specific jobs, and Total Cost of Parts, each with its percentage of total net sales. Cost of Labor lists Total Payroll Cost, the estimated gross payroll from your fixed expenses (or the actual payroll from the time sheets when the store records it), Total Sales Commissions and Total Tech Commissions earned on the invoices in the period, again with percentages. Gross Profit is Net Sales less Total Cost of Parts less Total Cost of Labor less Total Sales Commissions less Total Tech Commissions, shown as an amount and as a percentage of total net sales.
The lower half lists the operating expenses. Recurring Operating Expenses shows each fixed expense account you set up, such as Rent (Estimated), with the monthly amount prorated to the period: the monthly figure divided by 26 or 30, depending on the days-open choice, multiplied by the open days in the range. Accounts with an actual monthly payment entered in Expenses appear with (Actual) instead. The pencil icon beside an expense opens its account in Financial Accounts so you can change the amount. Total Recurring Expenses (Prorated) sums them. Daily Shop Paid Outs lists the paid-outs entered under Expenses → Daily Shop Paid Outs in the period, by account, with a Total Daily Shop Outs line. Total Operating Expenses is the two totals together, and Net Income/Loss Prior to Taxes (Gross Profit minus Total Operating Expenses) is the result, as an amount and as a percentage of total net sales; a negative figure is a loss for the period. Because every percentage is measured against net sales, a very short or very quiet period shows large percentages, so read the report over at least a full week.
The Estimated Profit Report tab above the filters leads to the older estimate view, and the Profit & Loss Report tab is this report. The Add To Favorites switch beside the heading saves the report under Favorites on the Reports page. Which reports you see depends on your admin group permissions.