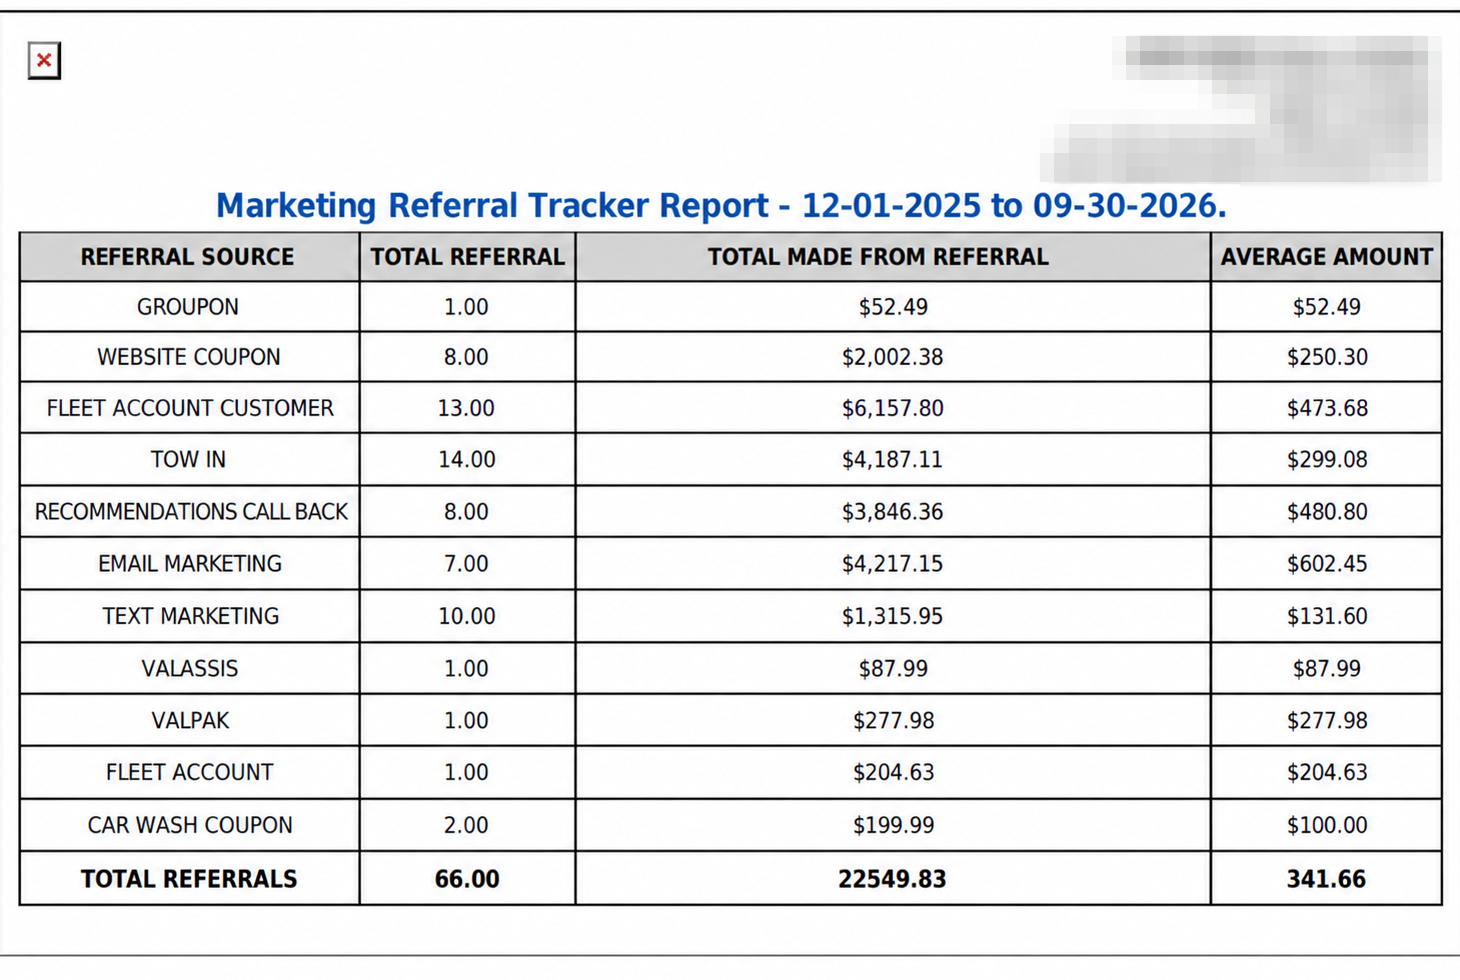
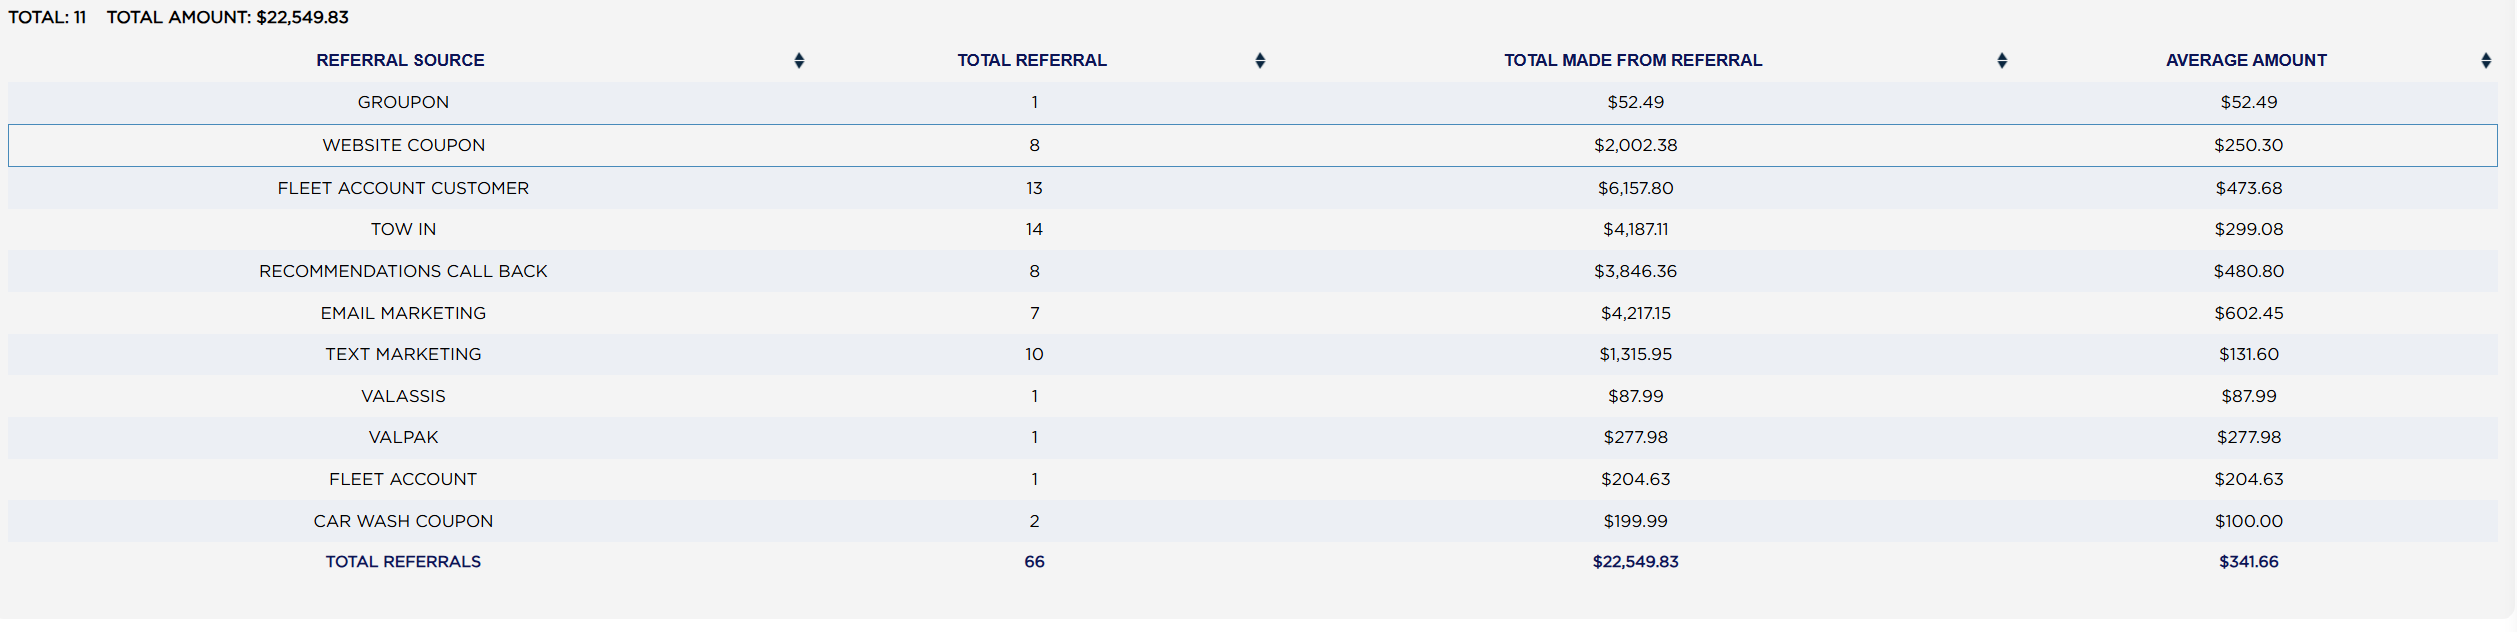
A month is usually too short a window for this report. Referral sources build up slowly, and over a few weeks most of them show a single customer, which tells you very little. Give it a year and the picture separates out.
Each line shows the REFERRAL SOURCE as it is set up in your customer records, the TOTAL REFERRAL — how many finalized invoices came from customers carrying that source — the TOTAL MADE FROM REFERRAL, which is the net sales on those invoices added together, and the AVERAGE AMOUNT those two give.
Above the table, TOTAL: is the number of different referral sources in the period and TOTAL AMOUNT: is the money across all of them. At the foot of the table, TOTAL REFERRALS adds the three money and count columns down the page. The two are not the same count — in the example, `TOTAL: 11` means eleven sources were used, while the footer's `66` is the number of customers they brought between them.
A customer only appears here if a referral source was recorded against them, so the report measures what you have been told rather than everything that happened. If the totals here are well below your actual sales for the period, the gap is customers with no source recorded, and that is a front-counter habit rather than a reporting fault. The ADD TO FAVORITES switch beside the report title saves a shortcut to the report under your favourites in the main Reports menu.