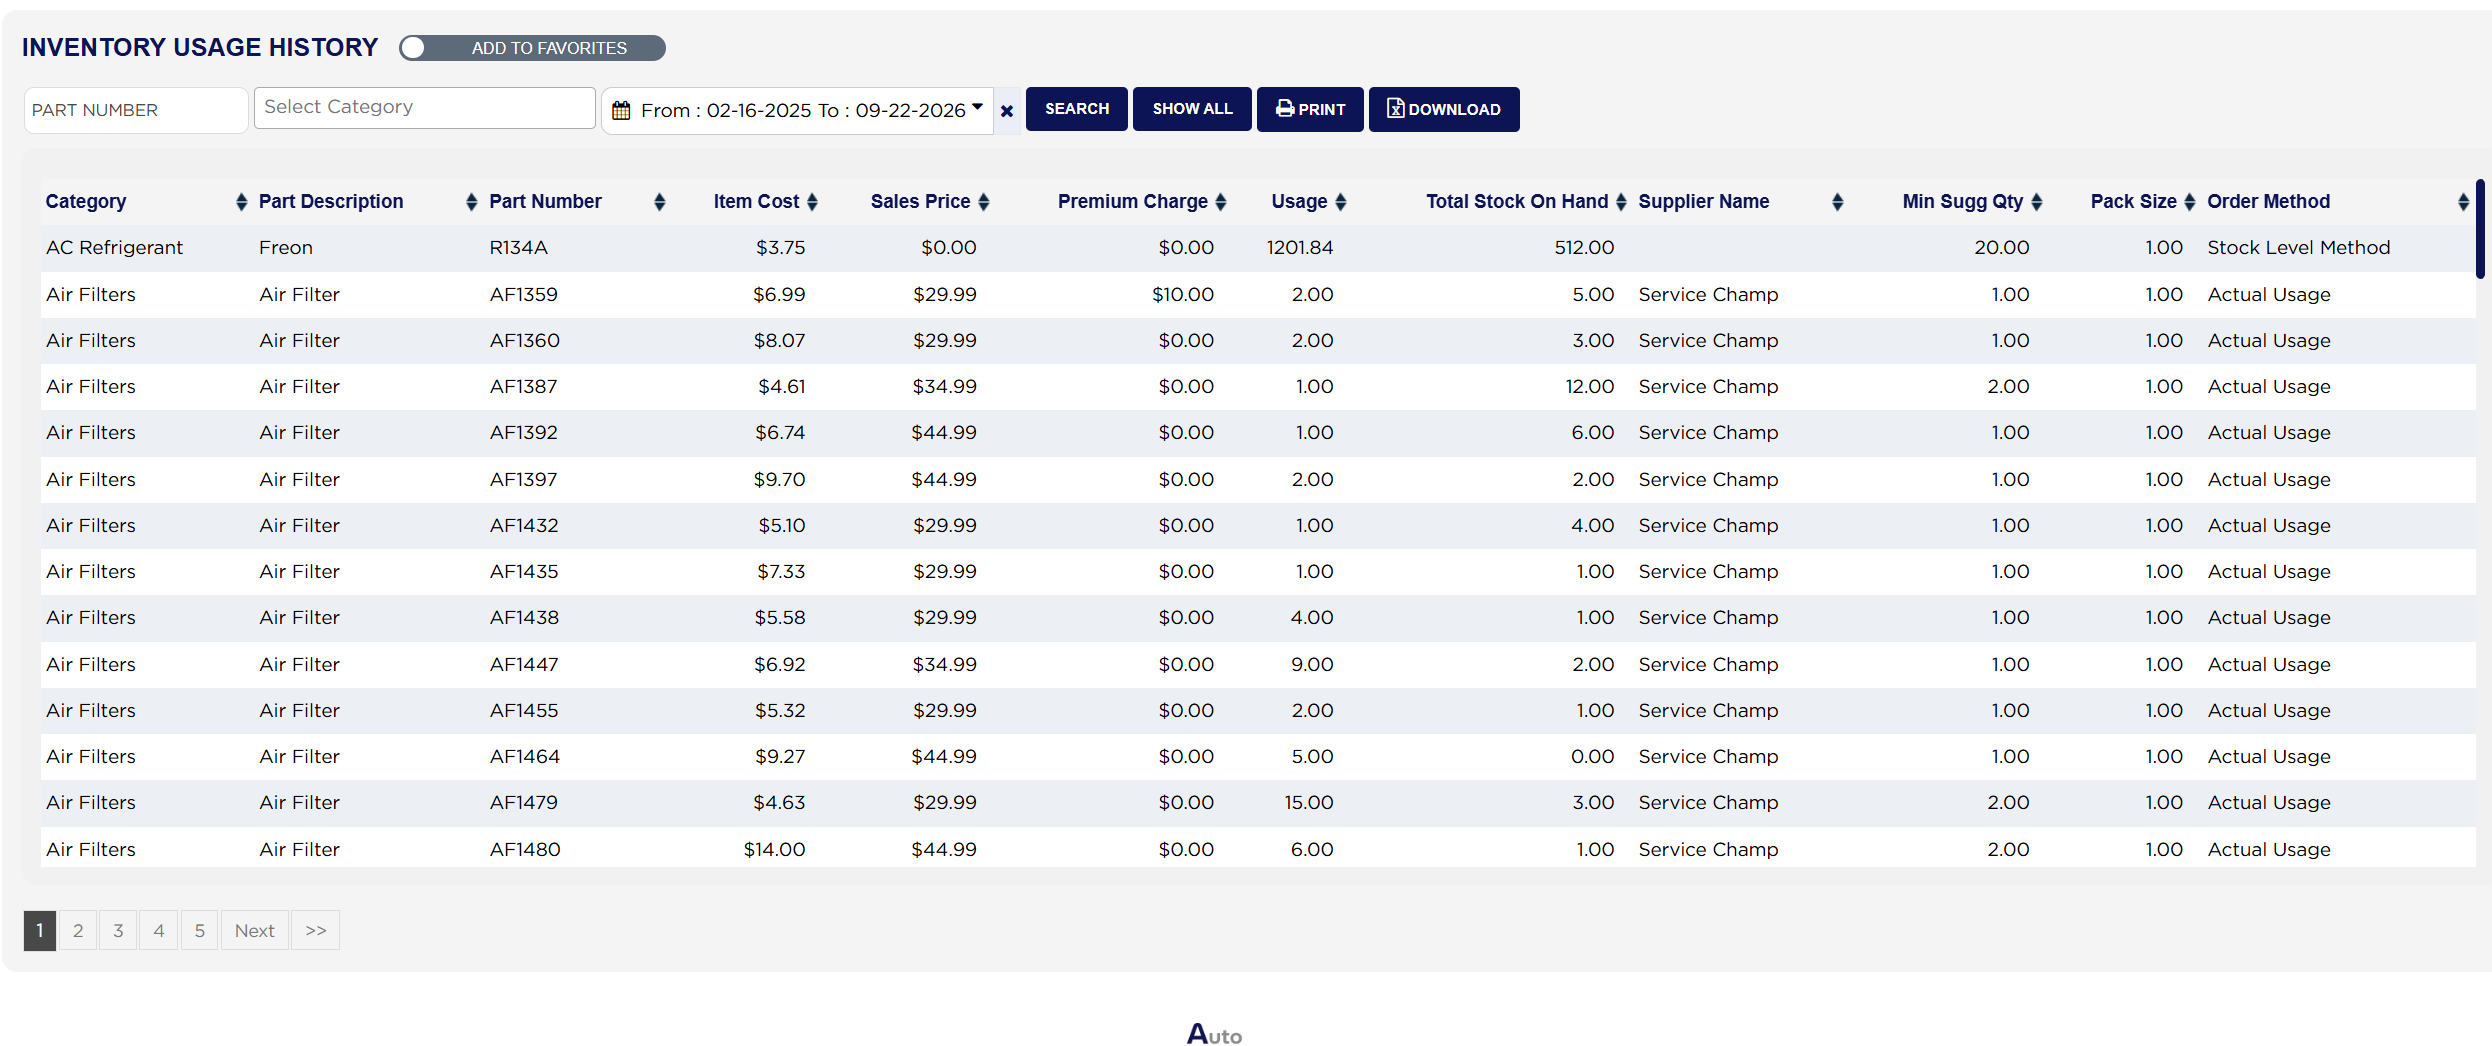
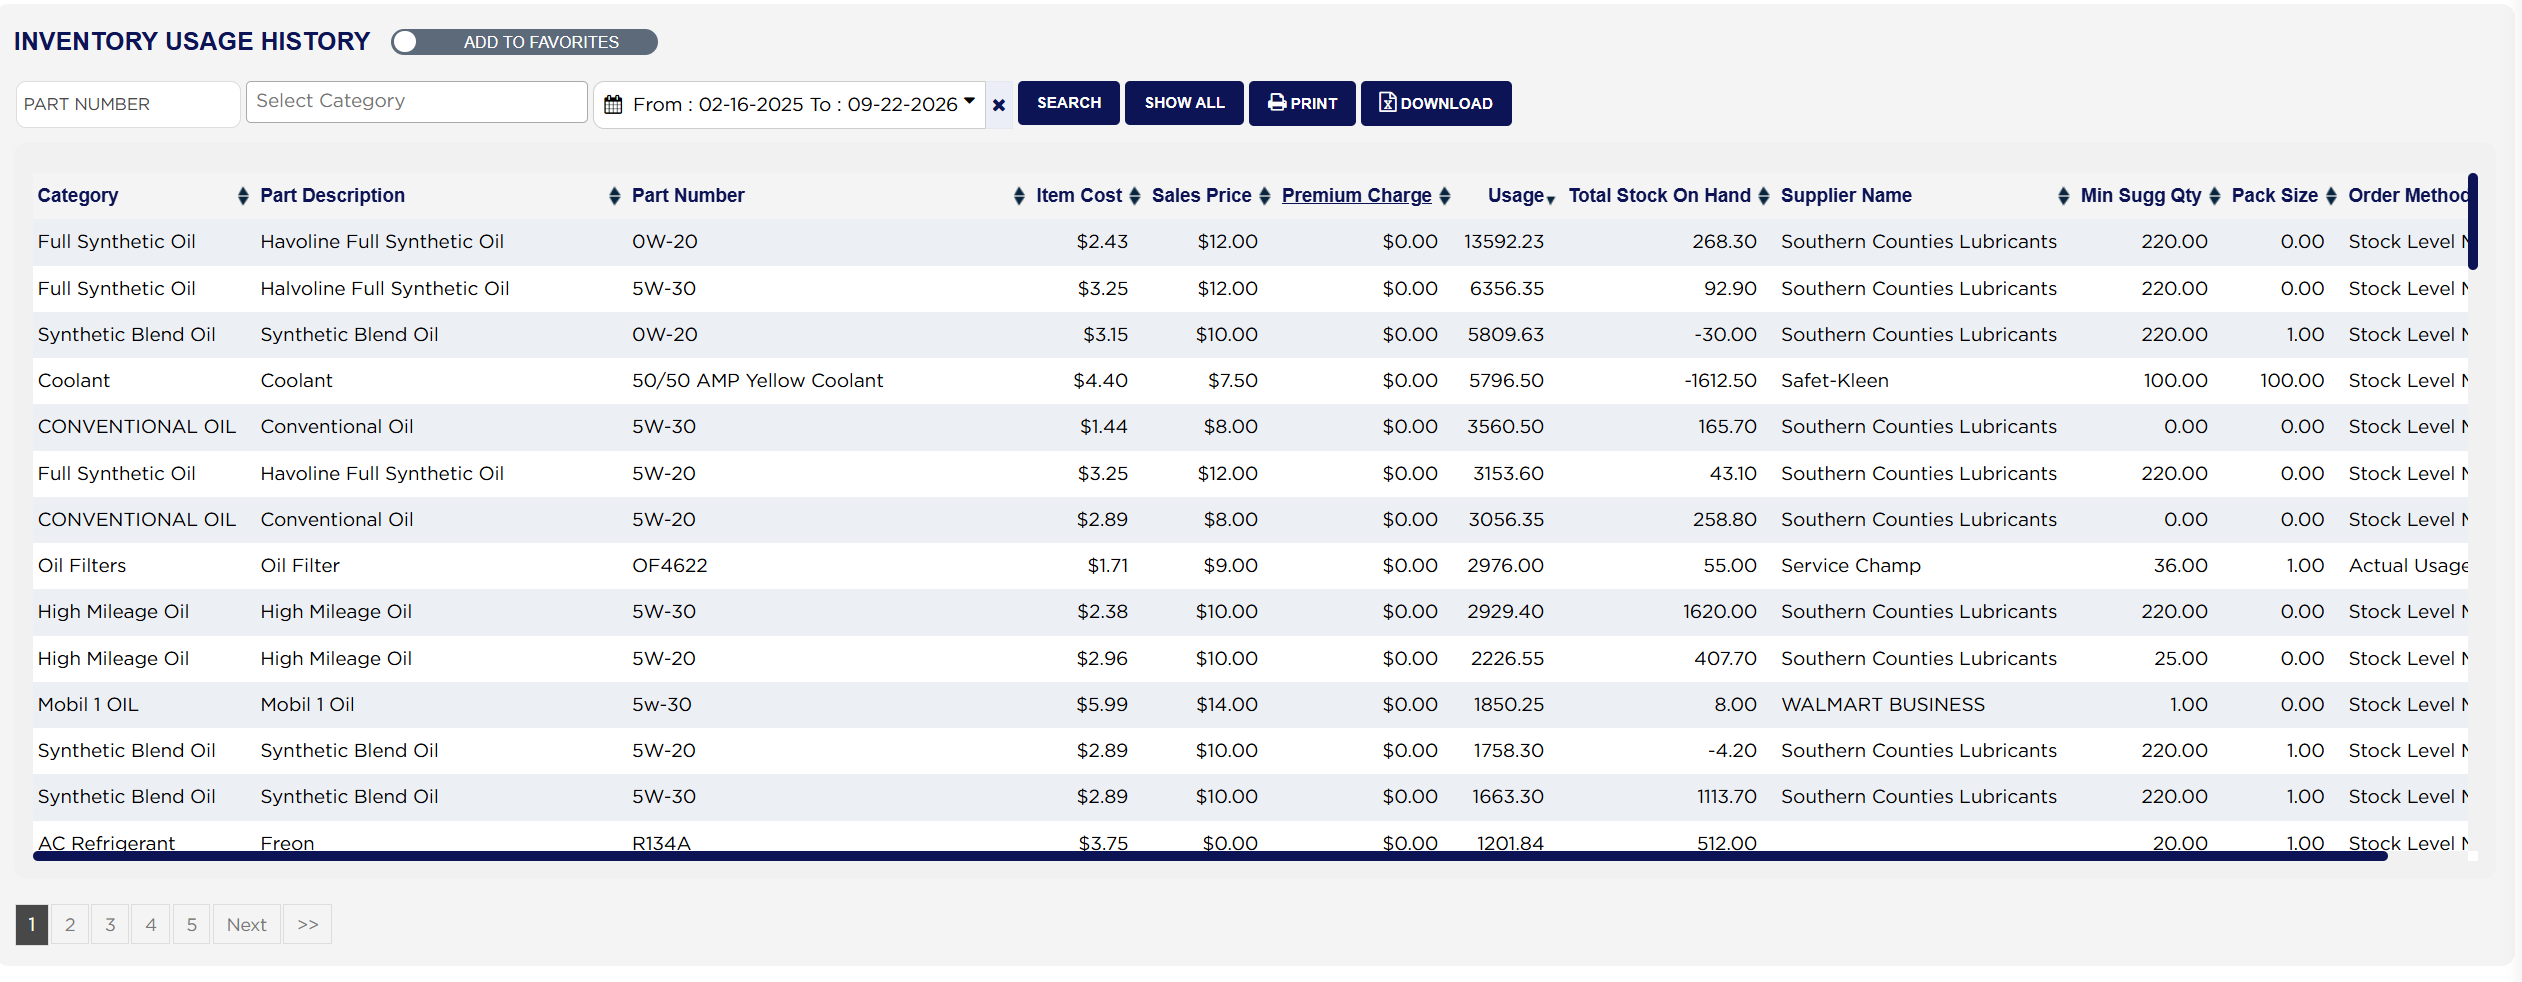
Each line shows the Category the part belongs to, its Part Description and Part Number, the Item Cost ARM holds for one, the Sales Price you charge, any Premium Charge added to it, the Usage — the quantity issued in the date range, which is what the report is really about — the Total Stock On Hand you are still holding, the Supplier Name it is bought from, the Min Sugg Qty below which it should be reordered, the Pack Size it comes in, and the Order Method ARM uses to reorder it, either Stock Level Method or Actual Usage.
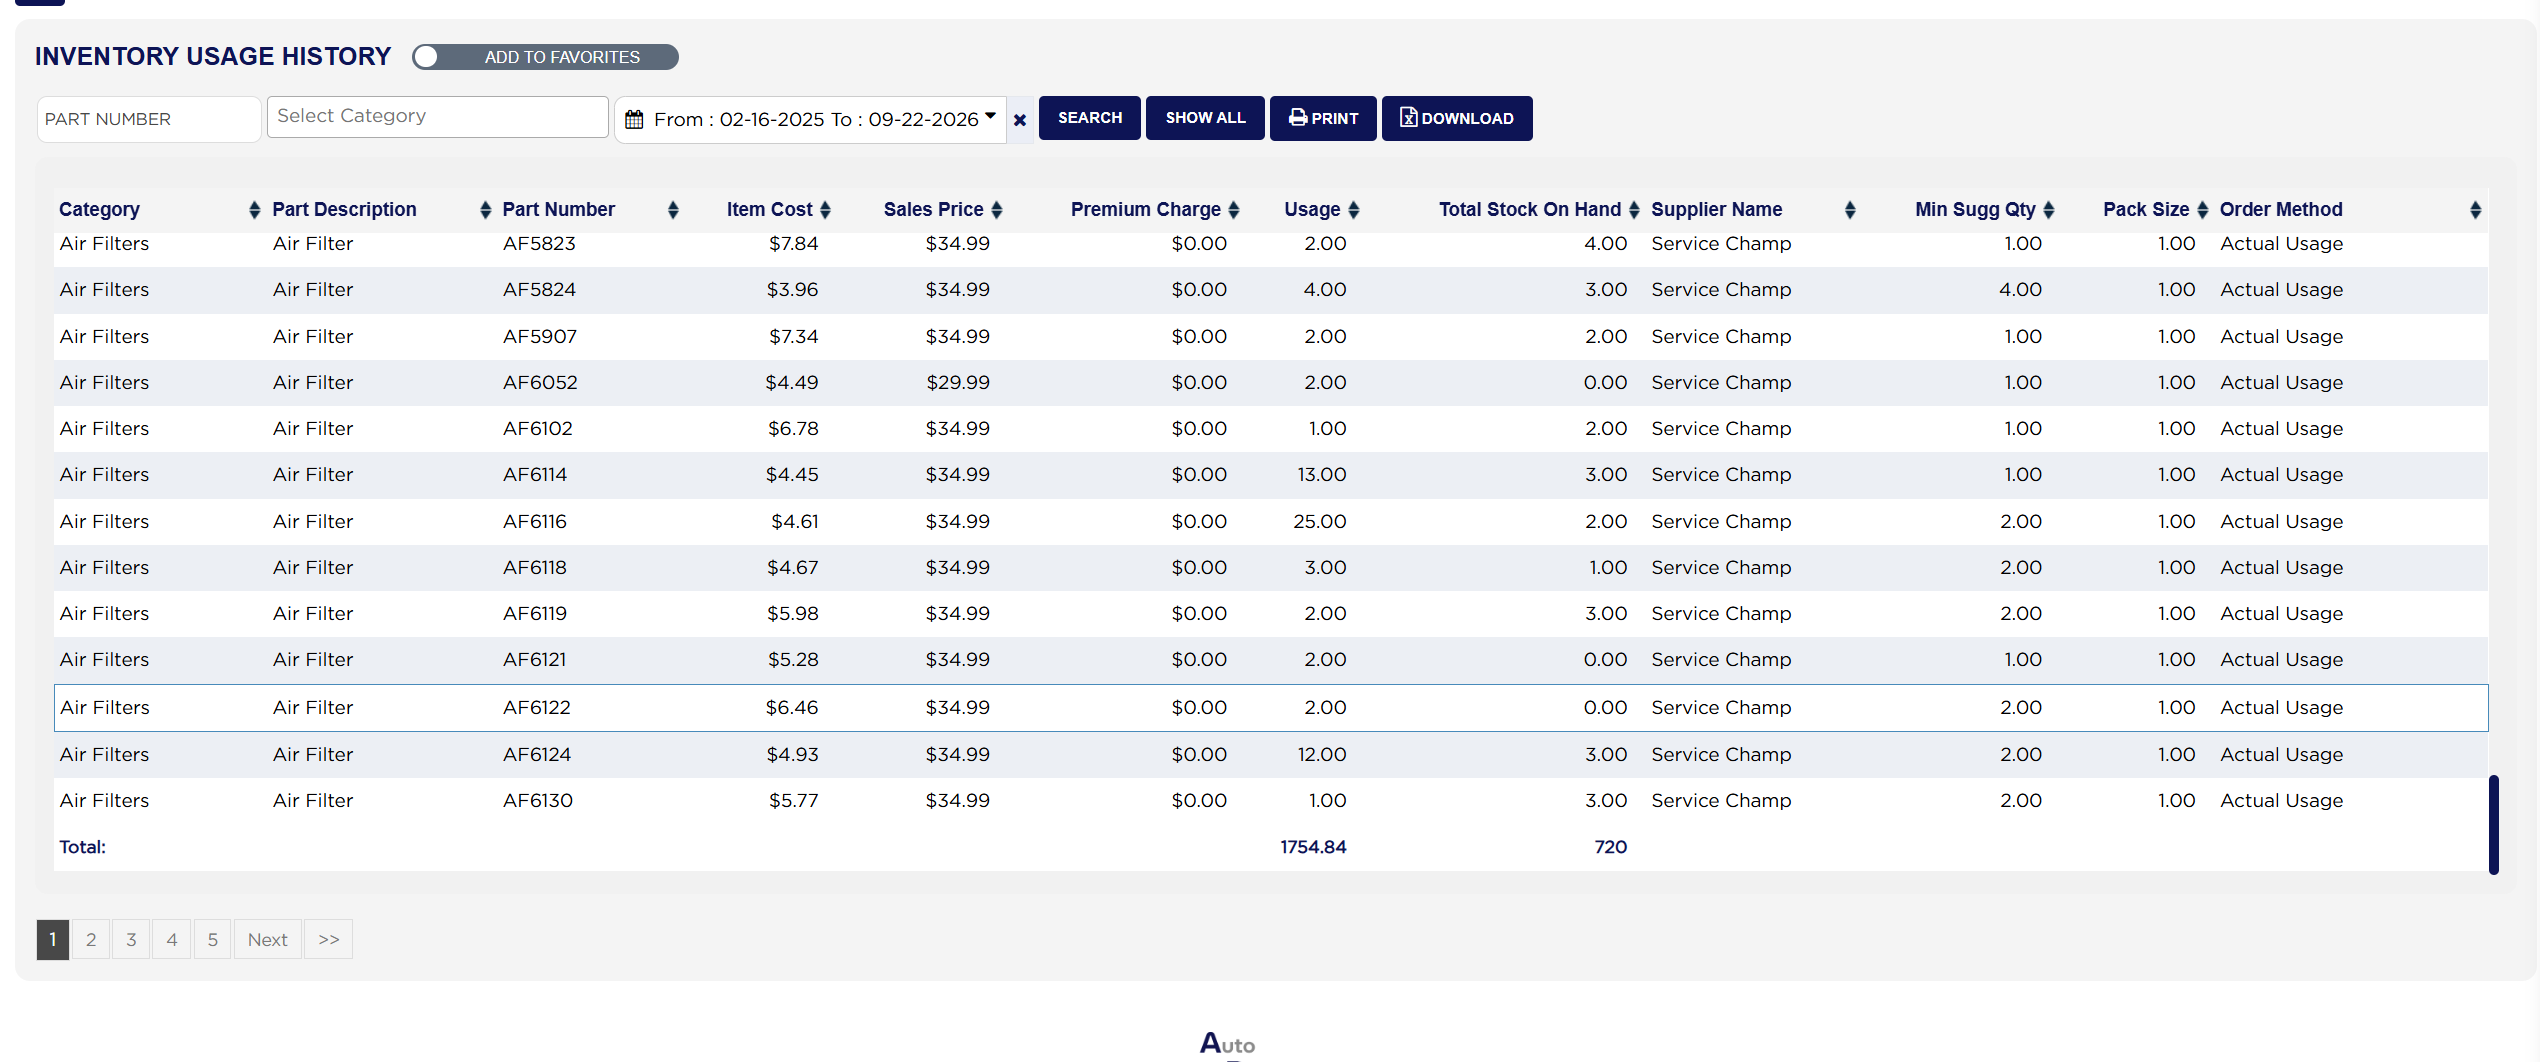
The Total: row at the foot of the table adds up two columns only, Usage and Total Stock On Hand; the other ten are left blank because a price or a pack size has nothing useful to add up. It totals the page you are looking at, not the whole report. With the list split over several pages, paging forward changes the figure. To total usage across a whole period, click DOWNLOAD and sum the Usage column in the spreadsheet.
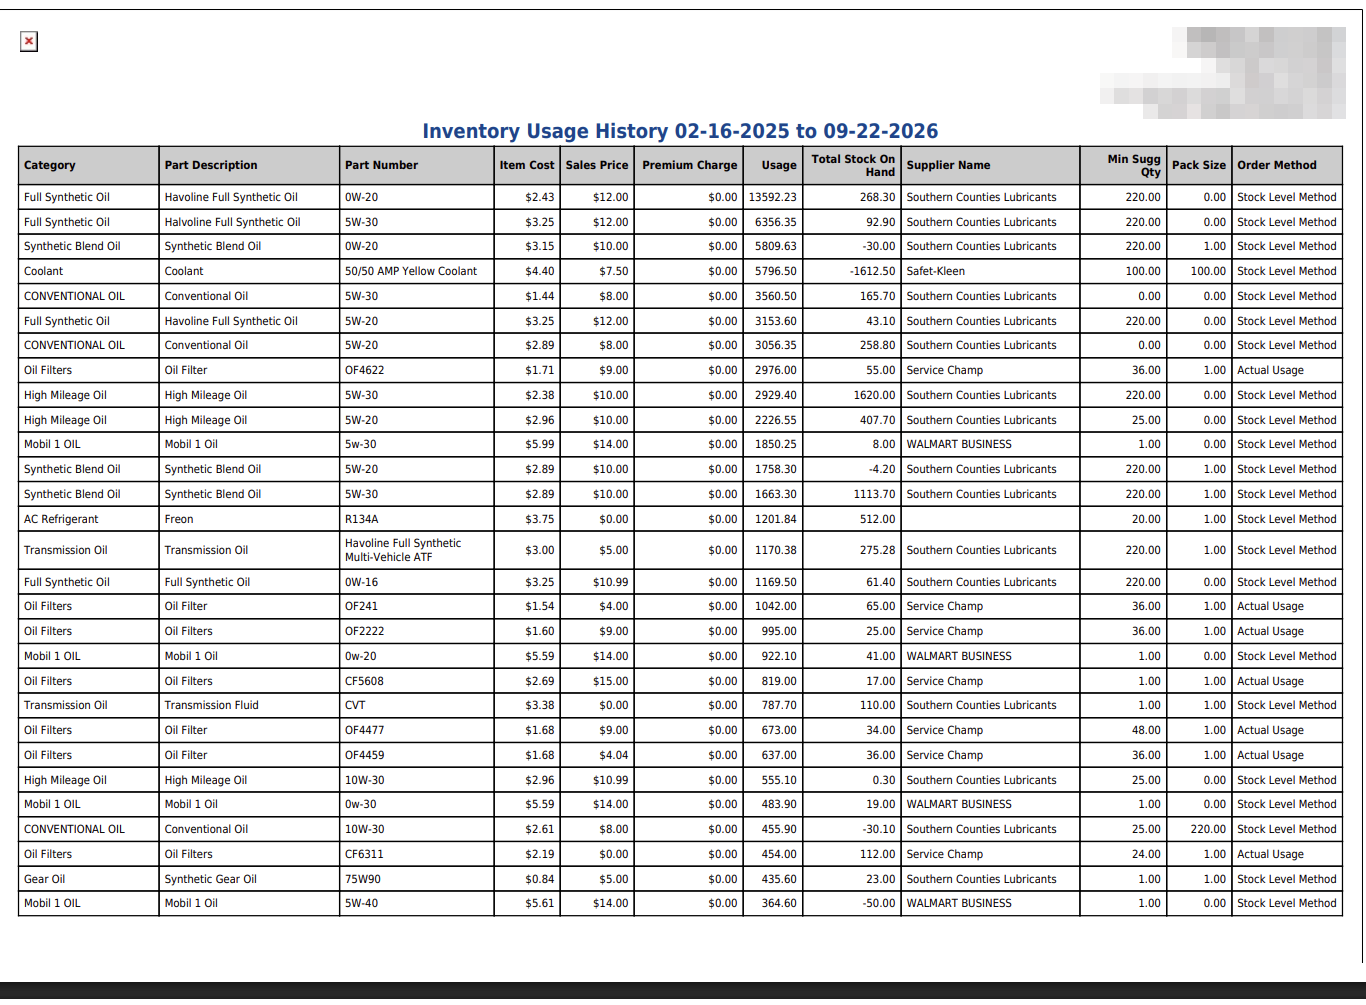
The printed PDF carries the same columns and the same lines, but no Total: row. Some parts show a negative Total Stock On Hand, which happens when more has been issued than ARM was told had been received; those parts are worth counting with Inventory Manual Count.
The ADD TO FAVORITES switch beside the report title saves a shortcut to the report under your favourites in the main Reports menu.