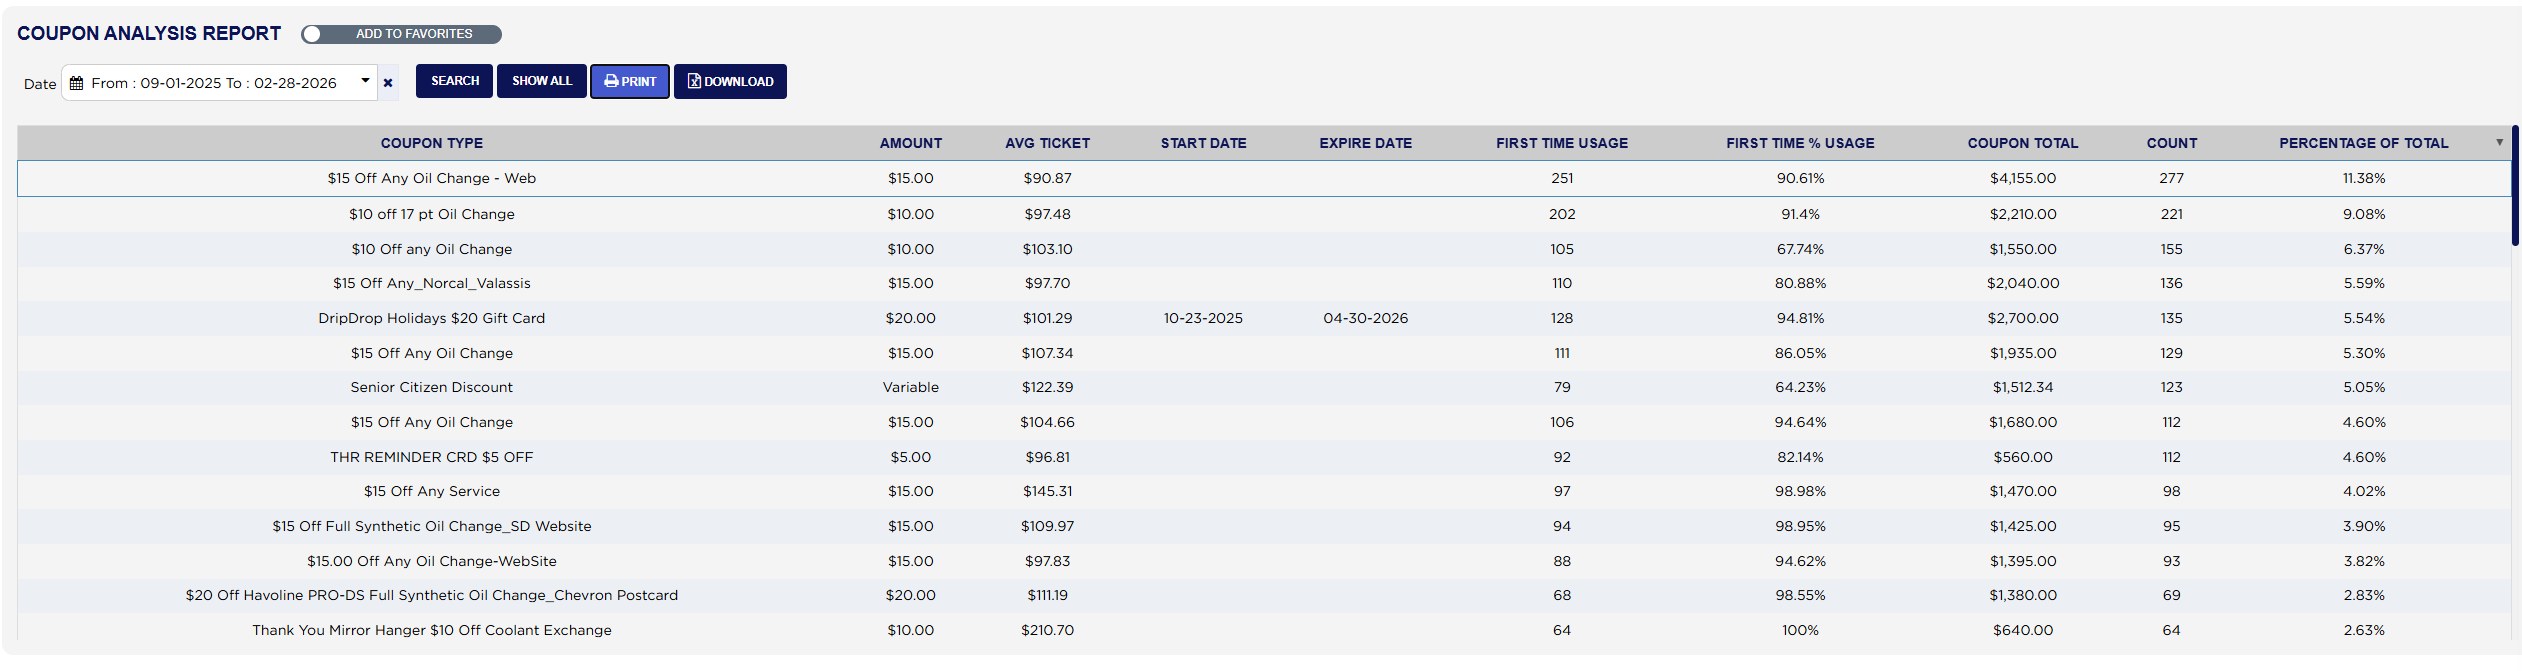
The main table lists every coupon used at least once in the period. Each line shows the COUPON TYPE (the coupon's name), the AMOUNT (its fixed dollar value, or Variable for a percentage coupon), the AVG TICKET (the average net sale on the invoices that used it), START DATE and EXPIRE DATE (shown only for coupons set up with an expiry date; the start date is the day the coupon was created), FIRST TIME USAGE, FIRST TIME % USAGE, the COUPON TOTAL (the discount it gave, parts and labor together), the COUNT (the number of invoices that used it) and its PERCENTAGE OF TOTAL, its share of all coupon uses in the period.
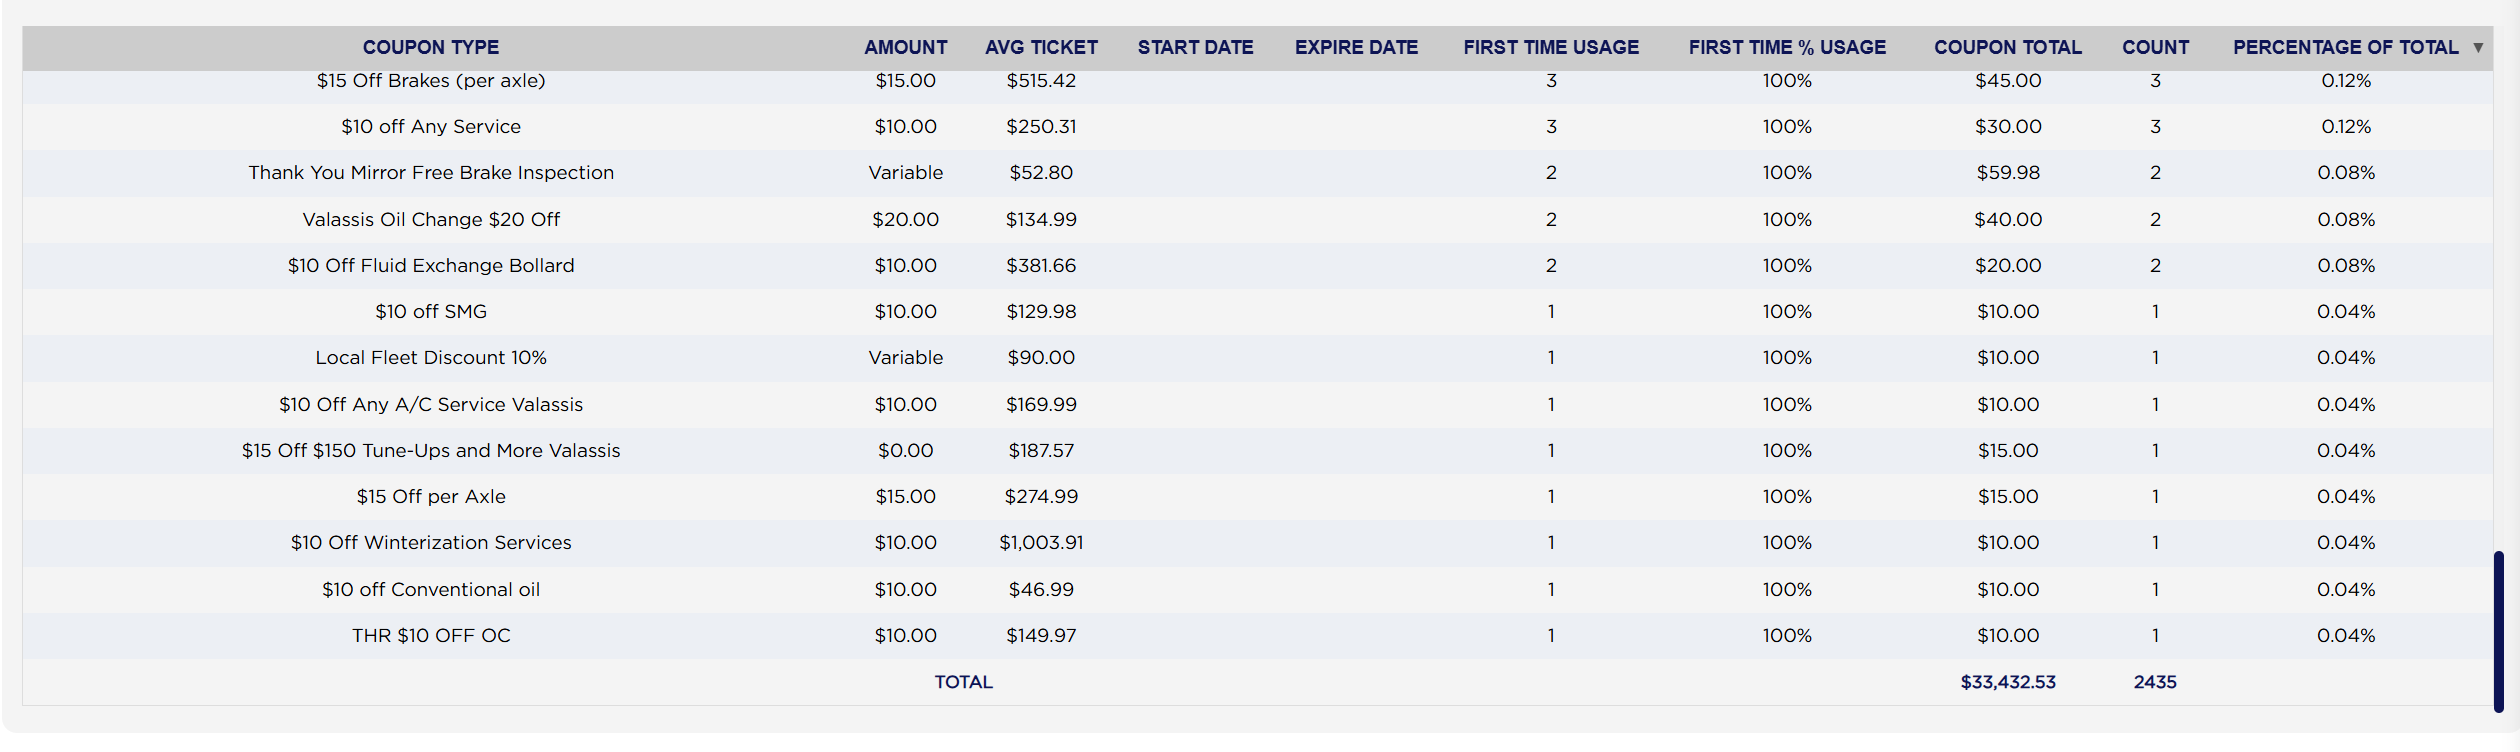
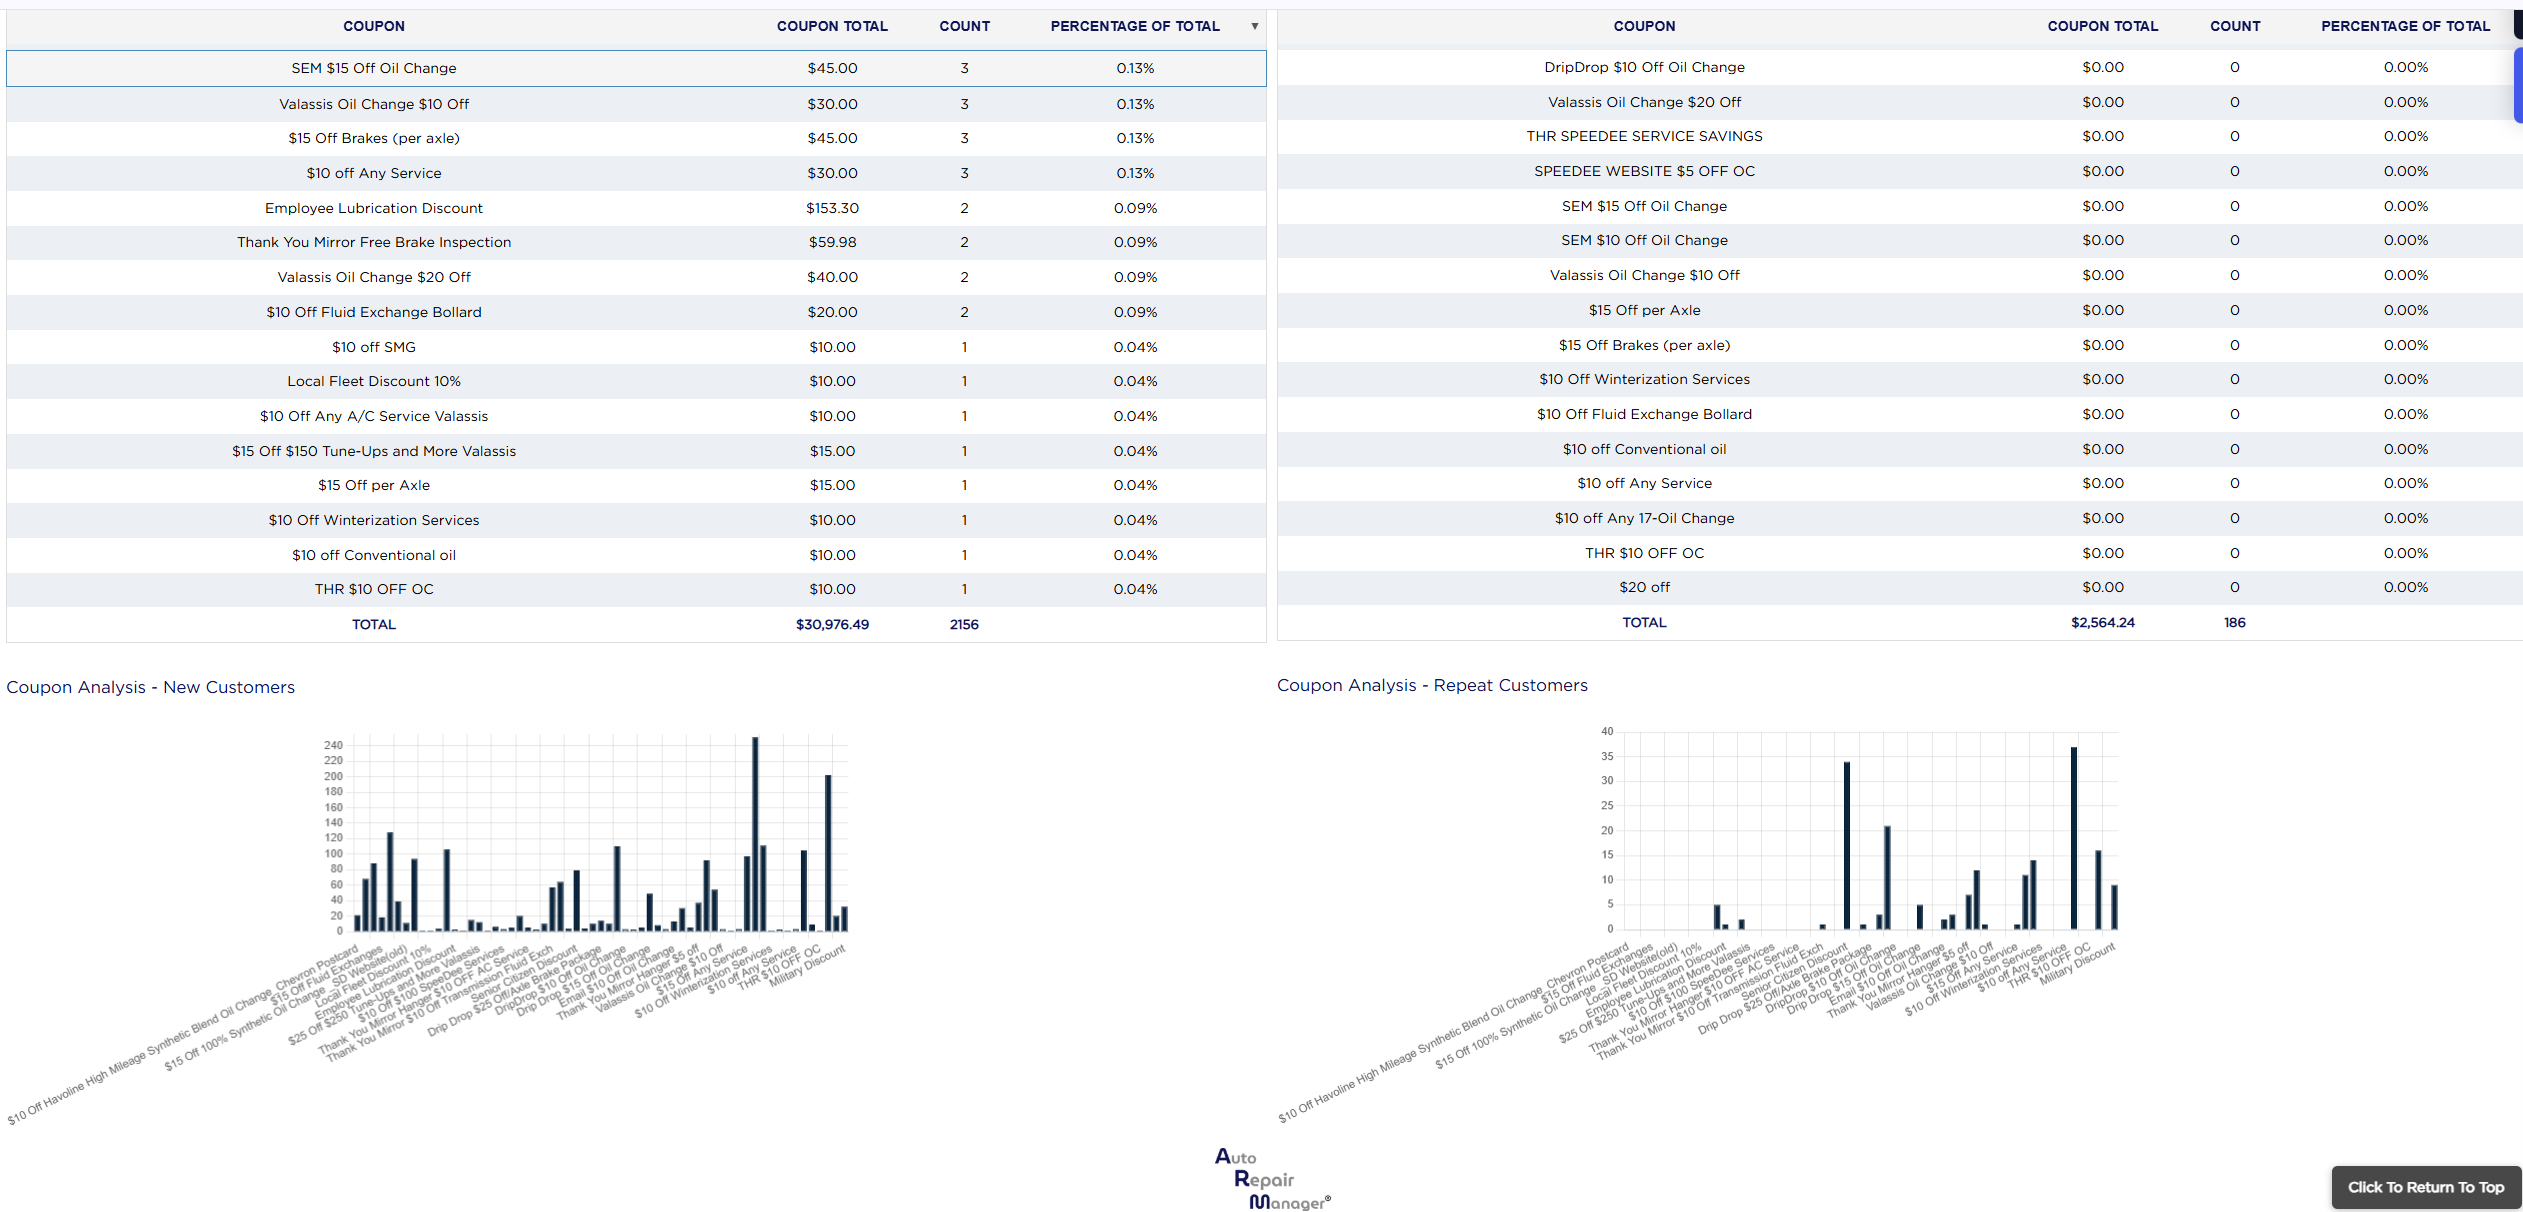
The TOTAL row at the foot adds up COUPON TOTAL and COUNT for every coupon in the table.
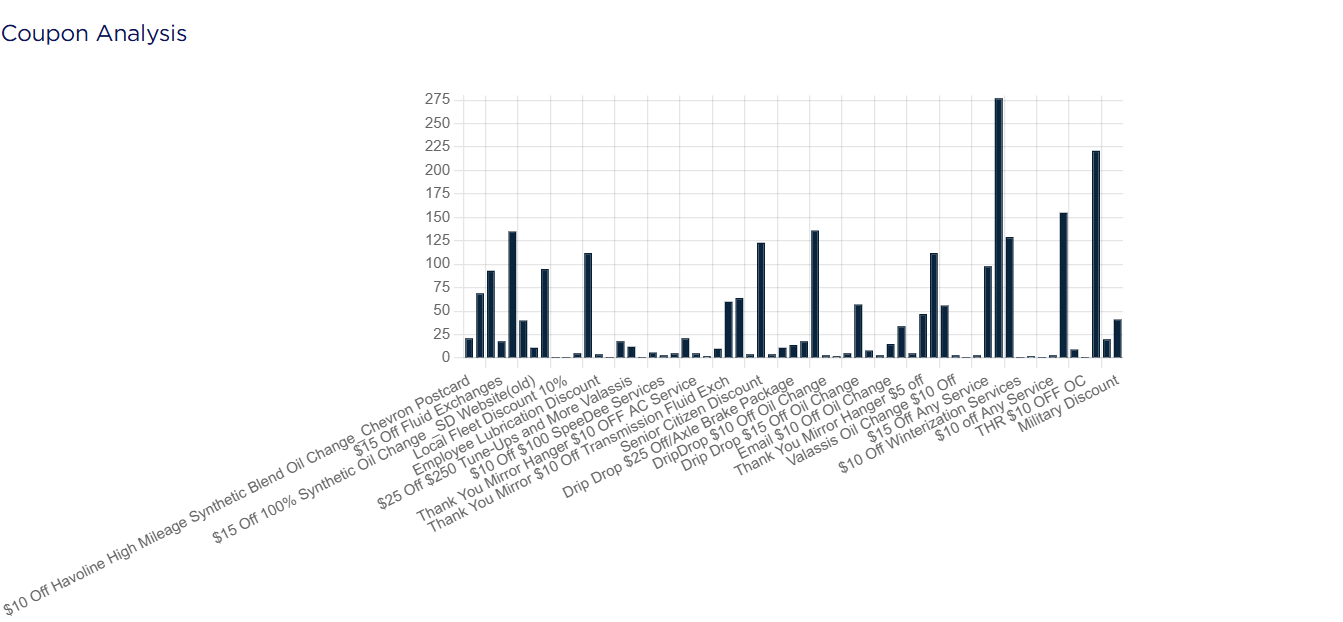
Under the table, the Coupon Analysis bar chart shows the COUNT for each coupon. When there are many coupons the chart leaves some bars unlabelled, so read the exact figures from the table.
What do "first time" and "repeat" mean on this report?
They are measured per coupon, against the start of your date range. A customer counts as first time for a coupon if they had not used that same coupon before your From date, and as repeat if they had. They do not tell you whether the customer is new to the shop, and a customer who uses a coupon twice inside your range still counts once, as first time. Moving the From date earlier moves customers from the repeat table to the first-time table.
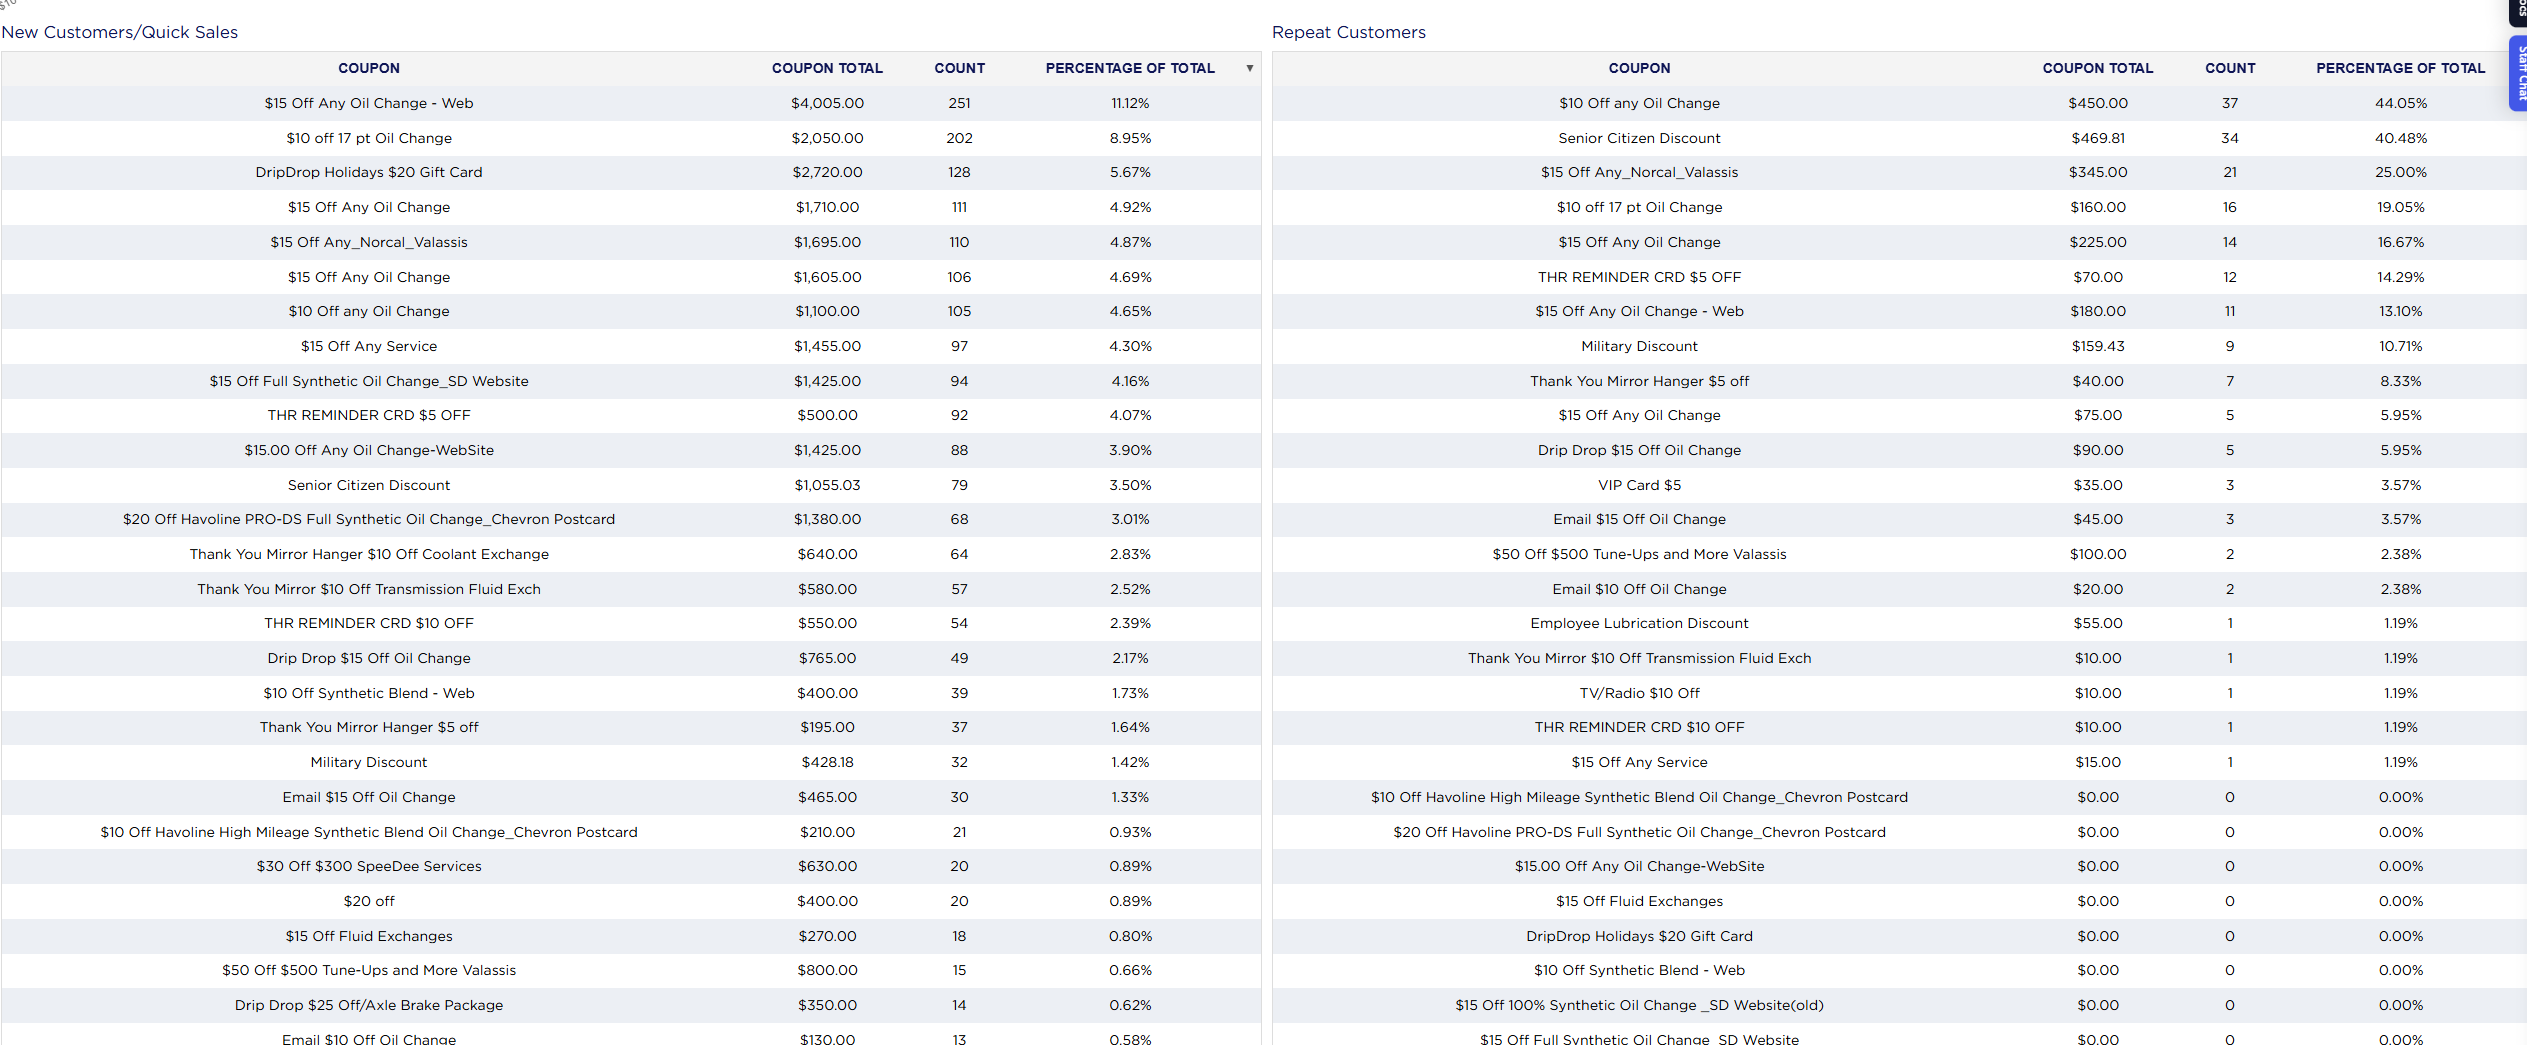
The New Customers/Quick Sales table lists each coupon with the COUPON TOTAL given to first-time users, their COUNT (the number of first-time customers), and a PERCENTAGE OF TOTAL. The Repeat Customers table does the same for repeat users. Each has a TOTAL row and its own bar chart.
Do not rely on the PERCENTAGE OF TOTAL column in these two tables. It is not worked out against the table's own total, so the column does not add up to 100 %. In the captured period the Repeat Customers percentages add up to more than 200 %. To see a coupon's share of the table, divide its COUNT by the table's TOTAL count. Example: 37 repeat users ÷ 186 = 19.89 %, where the column shows 44.05 %.
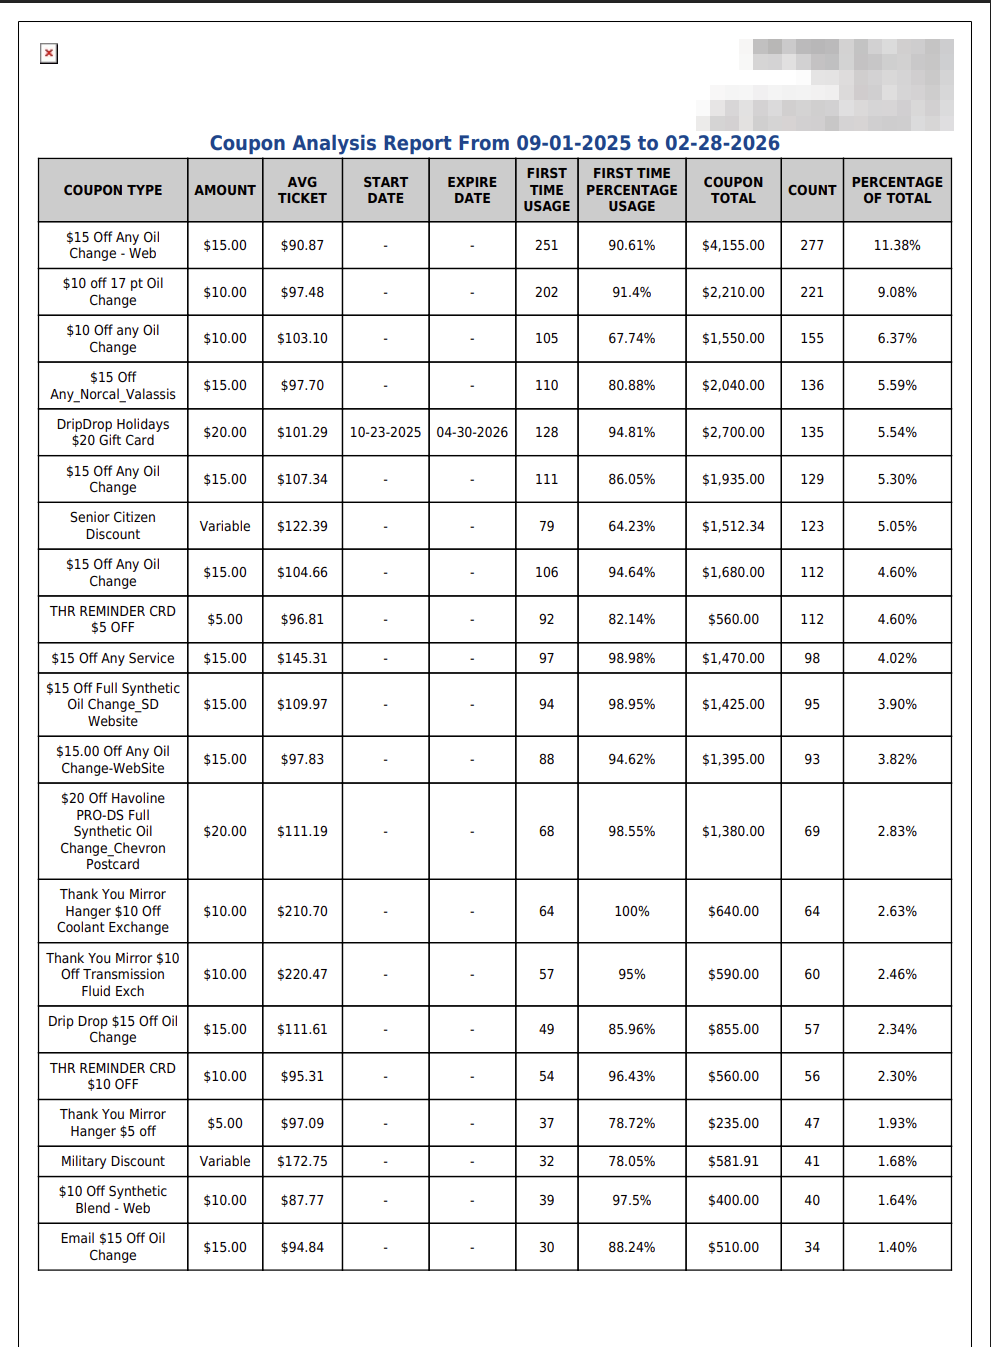
The printout is headed Coupon Analysis Report From with your dates and carries the same three tables and totals as the screen, without the charts. It heads the percentage column FIRST TIME PERCENTAGE USAGE, and it prints - where the screen leaves a date blank.
Coupons are set up in ARM's coupon settings. For the discount given by every coupon and every discounted service in one place, run Discount Tracking Summary Report.