ARM Help

Inventory Tracking Summary Report

Inventory Tracking Summary Report accounts for every part over a period: what you started with, what came in, what went out, what you adjusted by hand, and what you were left with. One line per part, and the line balances — the quantity you began with plus purchases, less usage, plus or minus any manual count adjustment, is the quantity you ended with. Use it to value stock at the start and end of a period, to prove a stock figure to an accountant, and to find out where a part's quantity went when it does not look right.

3 how-to answers 6 screenshots Open in ARM Markdown

How do I run the Inventory Tracking Summary Report? #

  1. From the Home Screen, click Inventory → Inventory Reports → Inventory Tracking Summary Report, or click Reports → Inventory Reports → Inventory Tracking Summary Report.
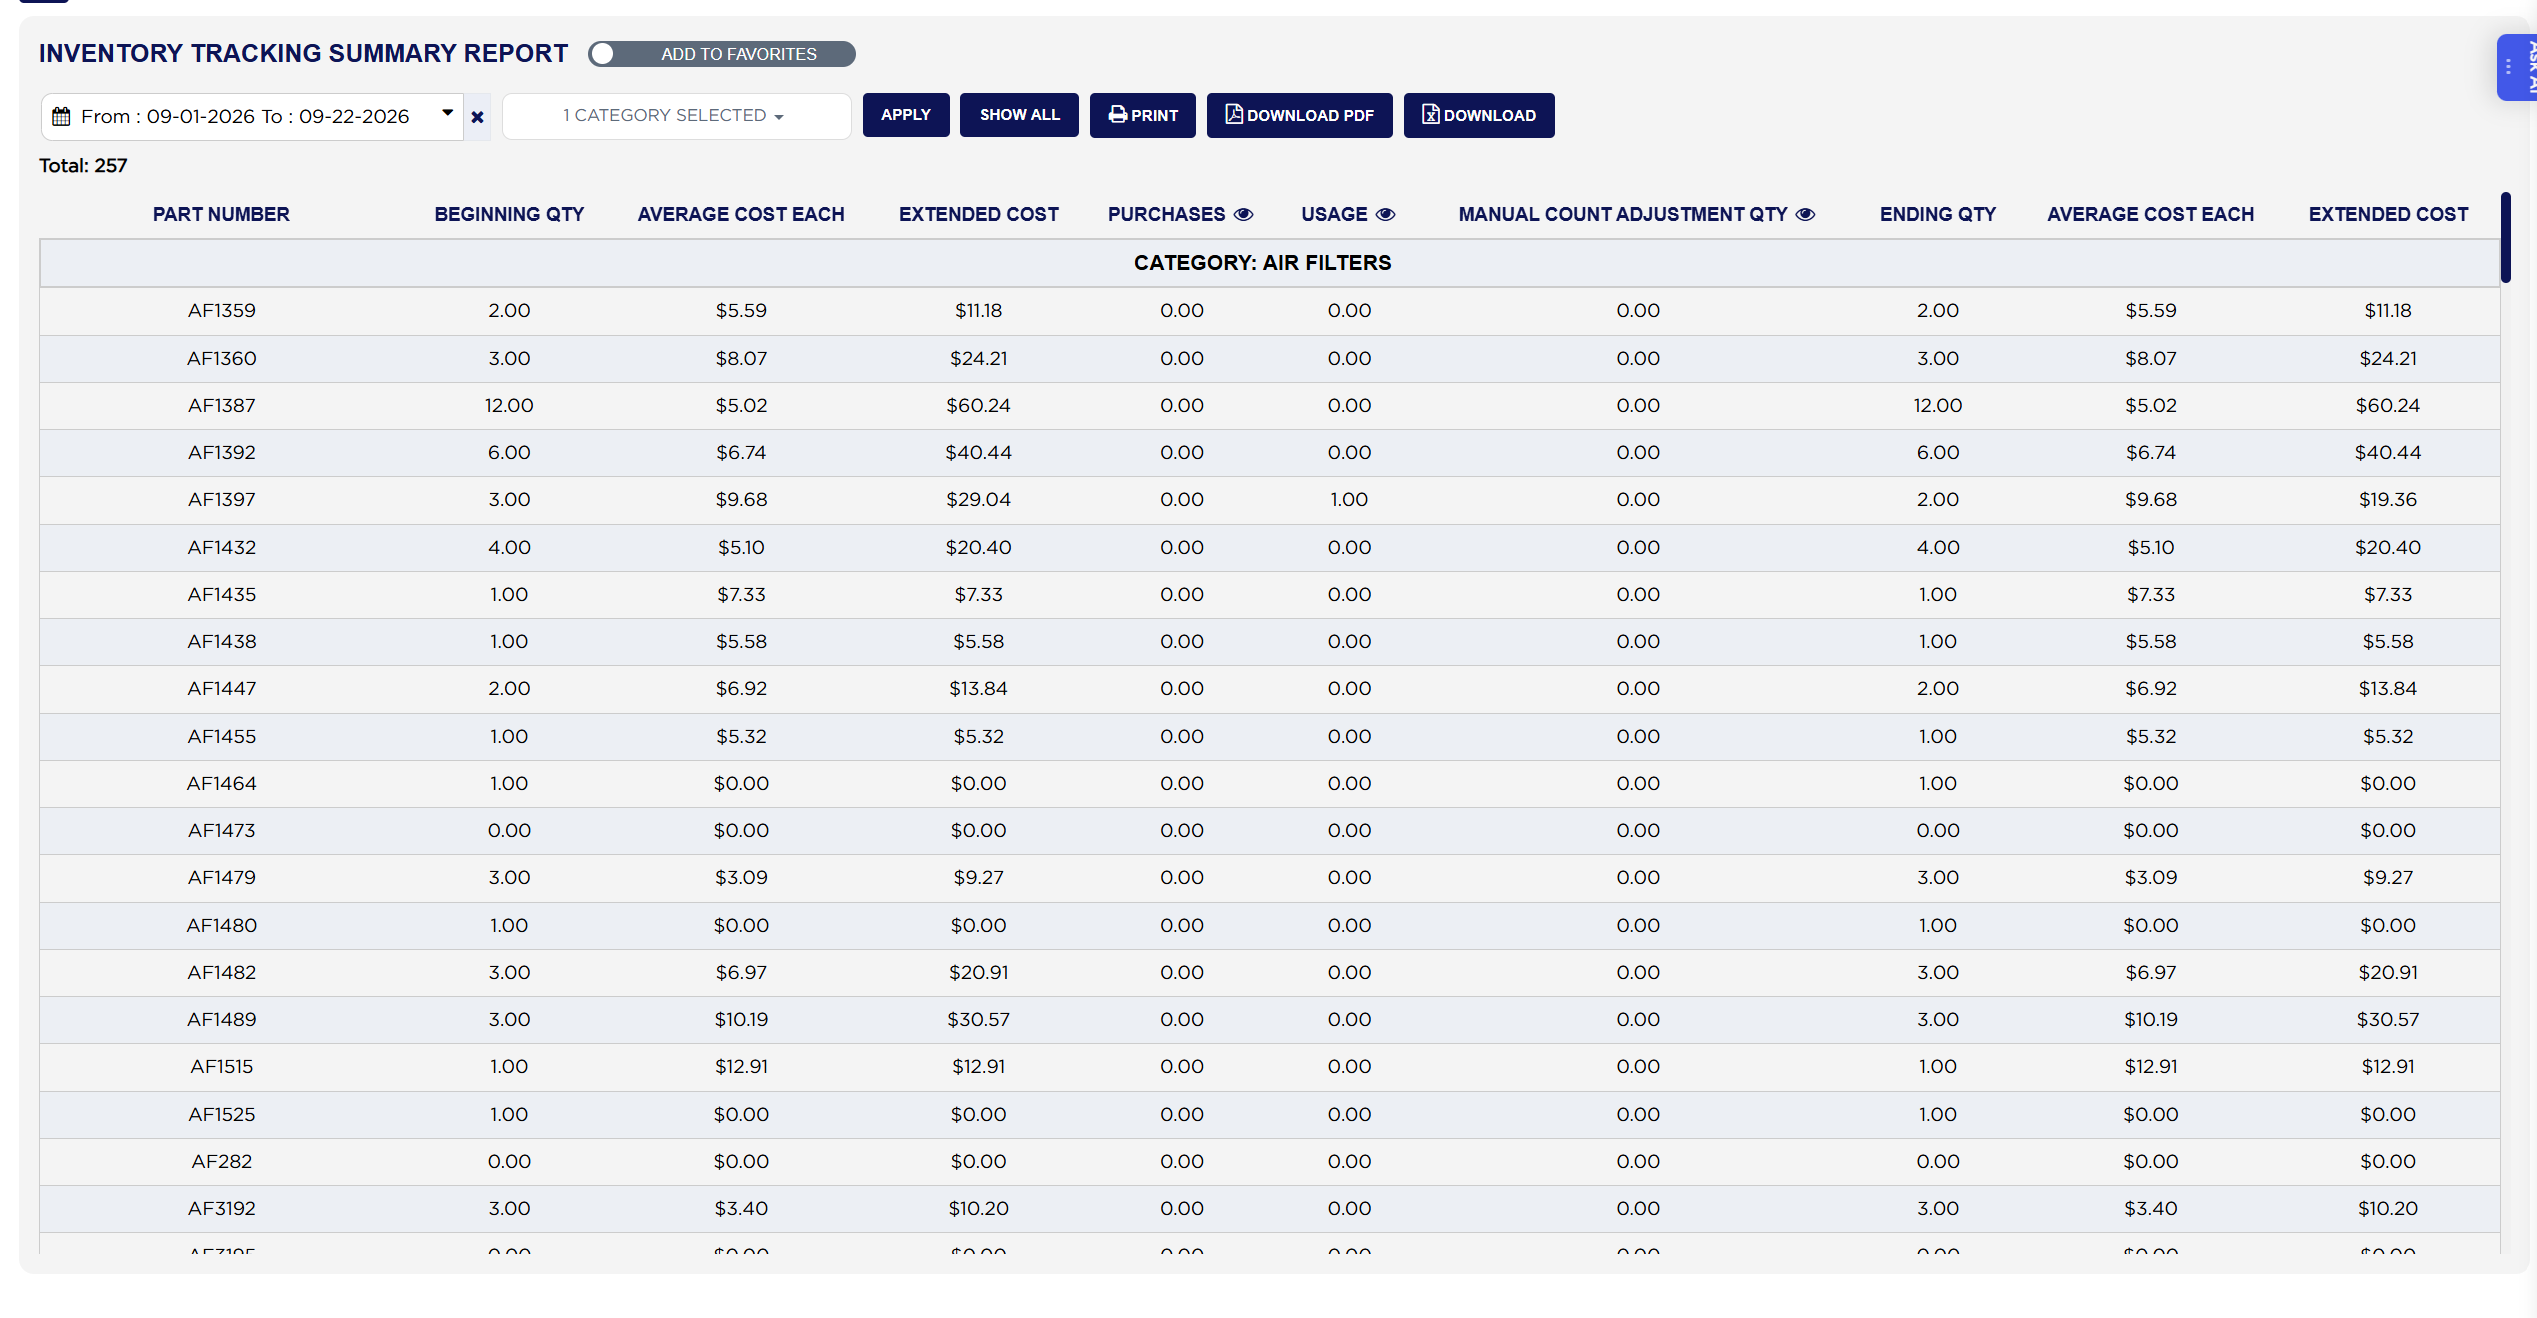
  2. Click the From : … To : … date box and pick the first and last day of the period. Beginning Qty is what you held at the start of it and Ending Qty what you held at the end.
  3. Tick the categories you want in the category selector, or pick a single part in the part number selector, to narrow the report.
  4. Click APPLY to load it. SHOW ALL clears the filters and reloads for the same dates.
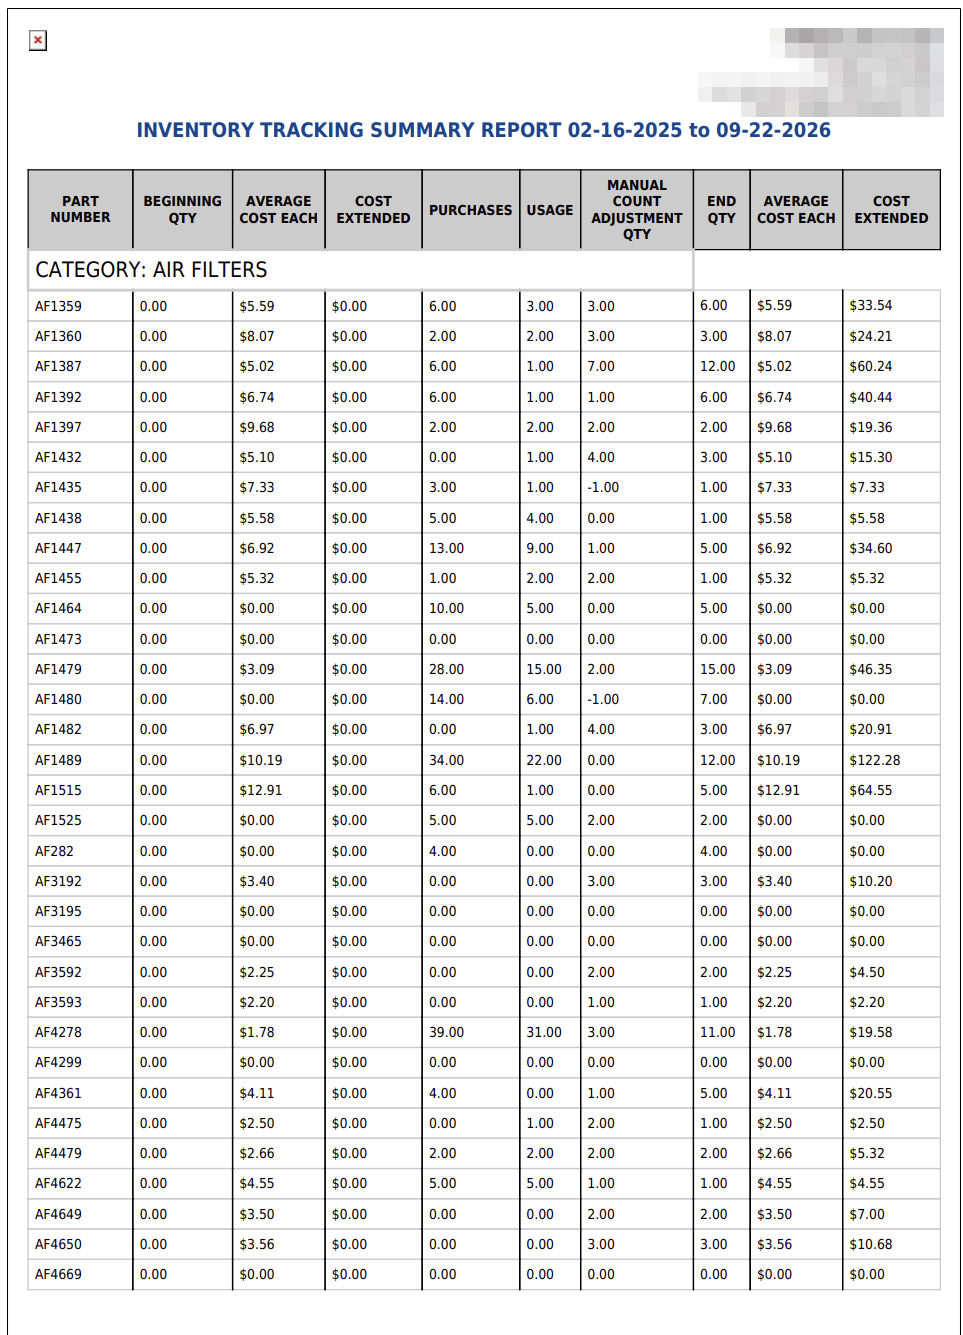
  5. Click PRINT for a PDF in a new tab, DOWNLOAD PDF to save that same PDF, or DOWNLOAD to export the table to a spreadsheet. All three appear only when the report has rows.
Inventory Tracking Summary date range, category and part number filters
Inventory Tracking Summary print output

How do I see what made up a part's purchases, usage or adjustments? #

  1. From the Home Screen, click Reports → Inventory Reports → Inventory Tracking Summary Report, and run it for your date range.
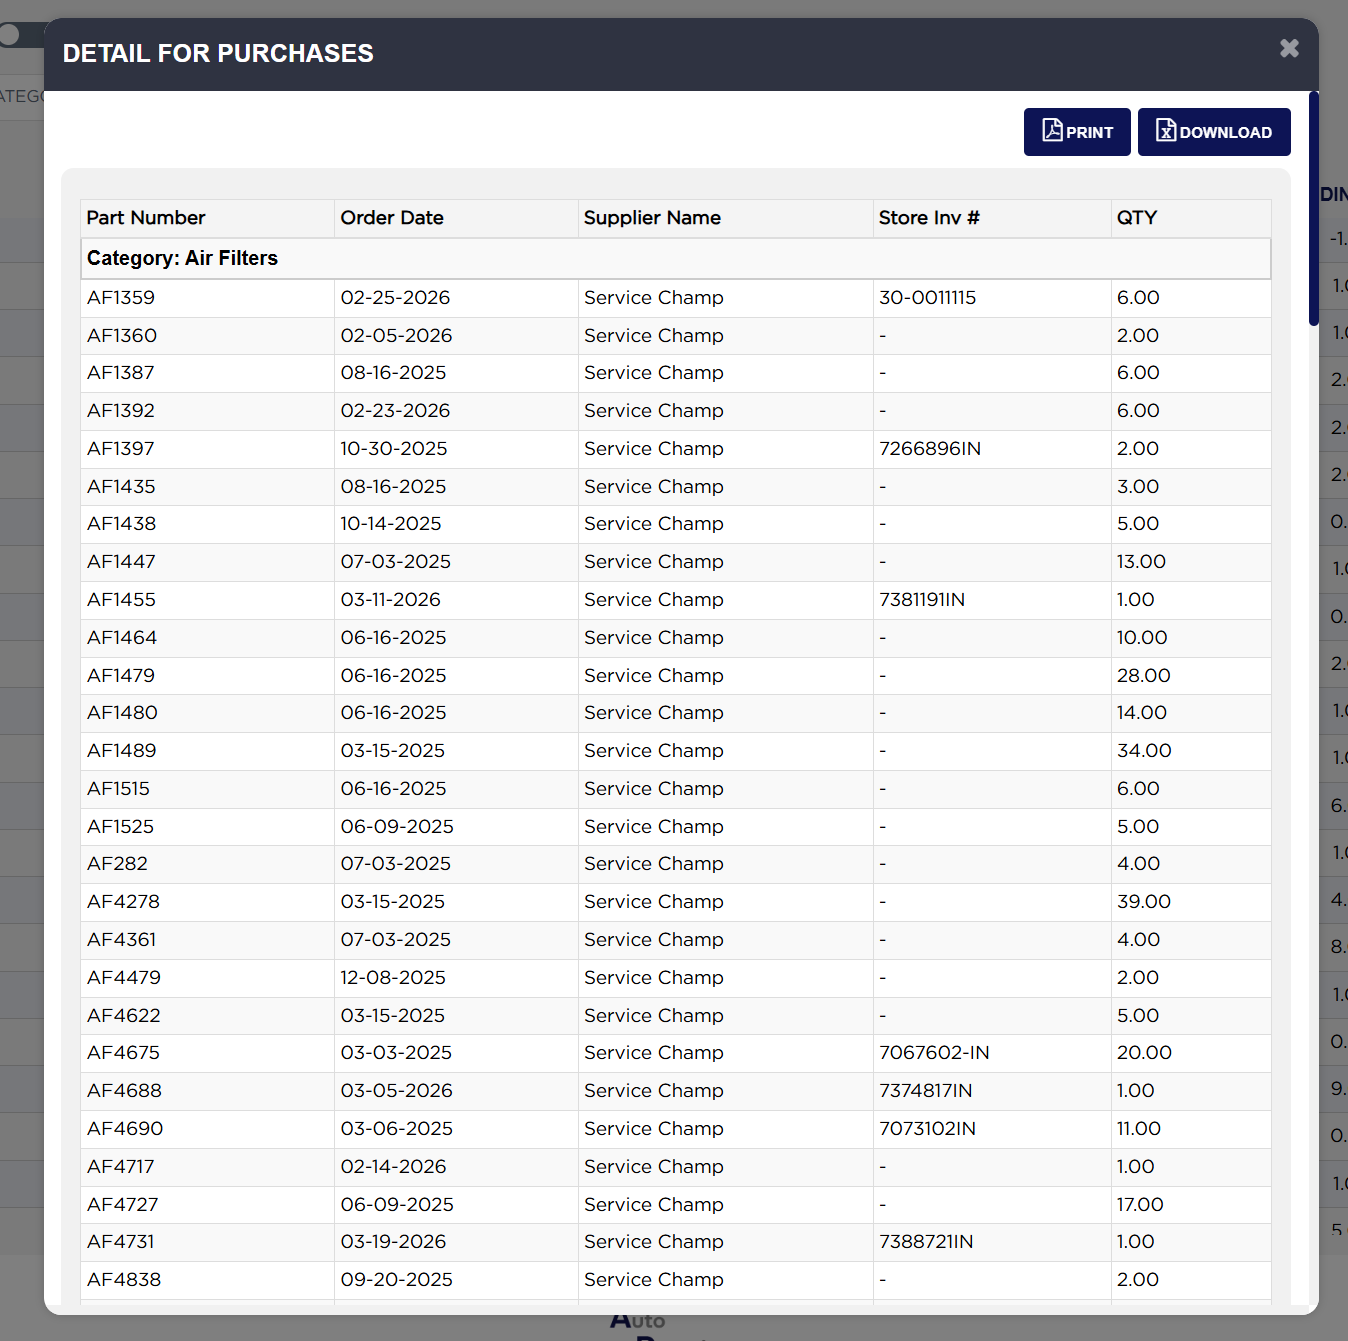
  2. Click the small eye icon in the PURCHASES heading. The Detail for Purchases popup lists every receipt behind that column, with the Part Number, the Order Date, the Supplier Name, the Store Inv # the delivery came in on, and the QTY received.
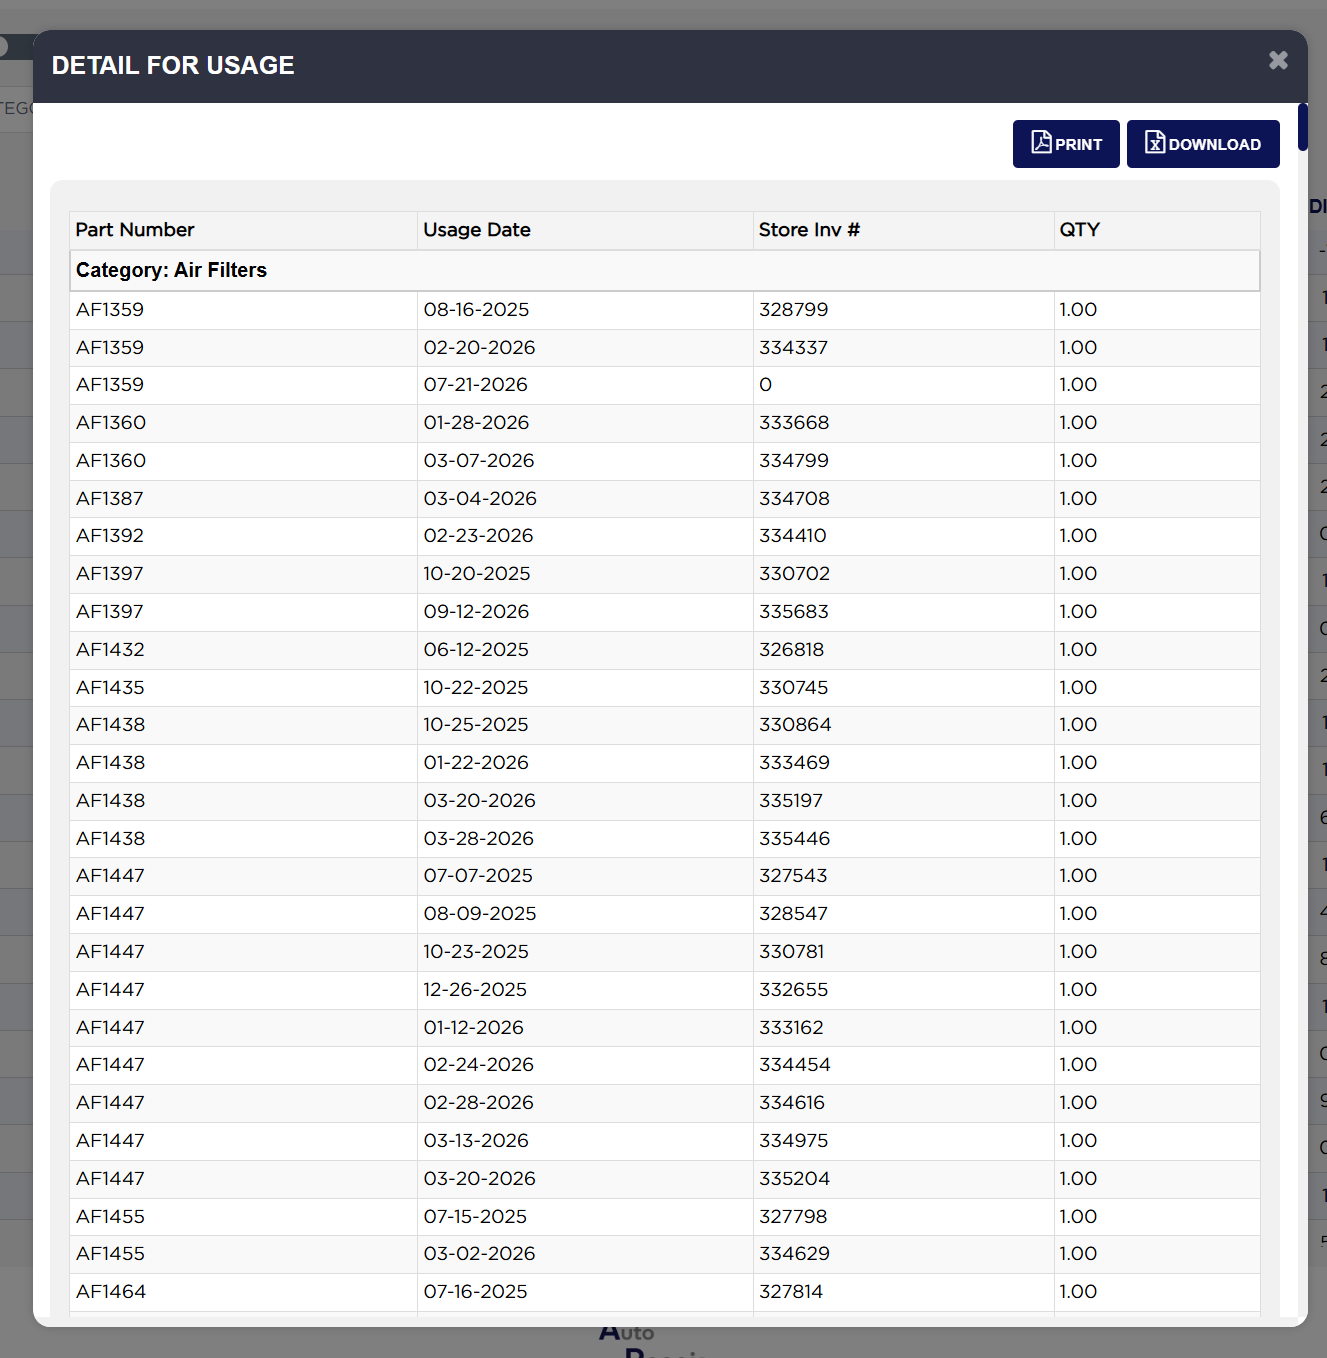
  3. Click the eye icon in the USAGE heading for Detail for Usage, which lists each issue with the Part Number, the Usage Date, the Store Inv # it went out on, and the QTY.
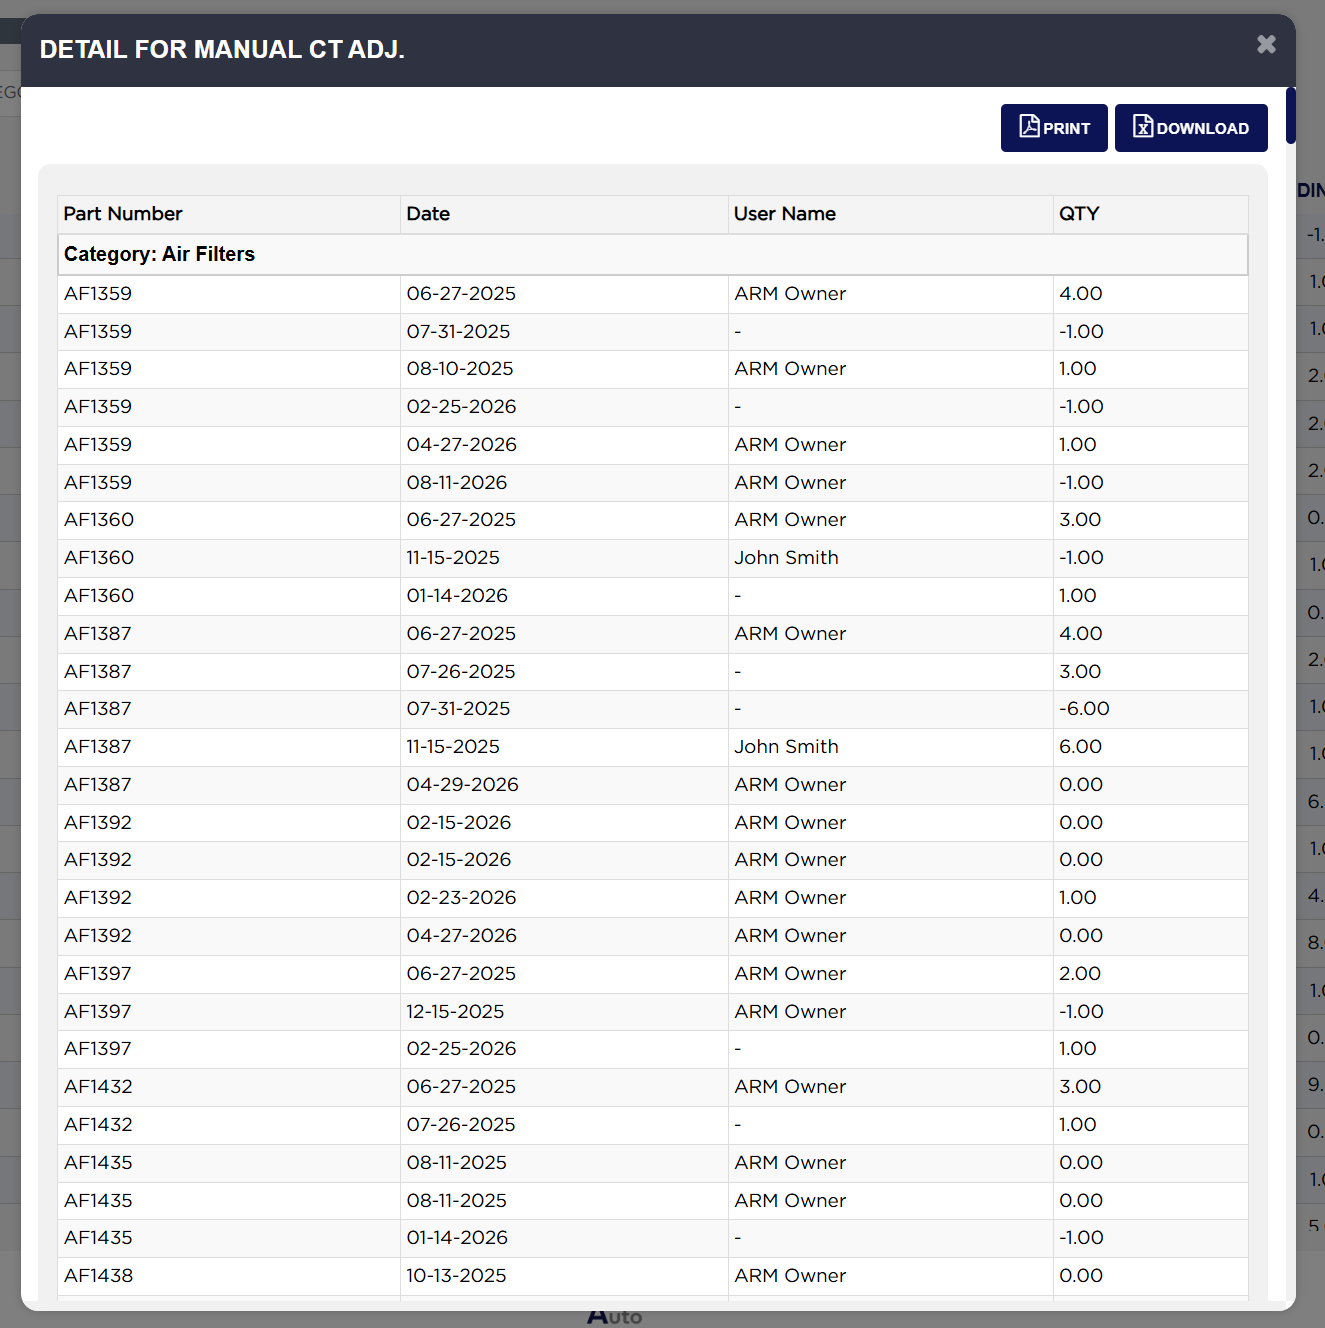
  4. Click the eye icon in the MANUAL COUNT ADJUSTMENT QTY heading for Detail for Manual Ct Adj., which lists each adjustment with the Part Number, the Date, the User Name who made it, and the QTY. A quantity here can be negative, where a count found less on the shelf than ARM held, and the User Name is sometimes blank on older adjustments.
  5. Each popup has its own PRINT and DOWNLOAD buttons, and closes on the × at the top right.
Detail for Purchases popup
Detail for Usage popup
Detail for Manual Ct Adj. popup

How do I work out the ending quantity and its value on one line? #

  1. From the Home Screen, click Reports → Inventory Reports → Inventory Tracking Summary Report, run it for your date range and pick one line.
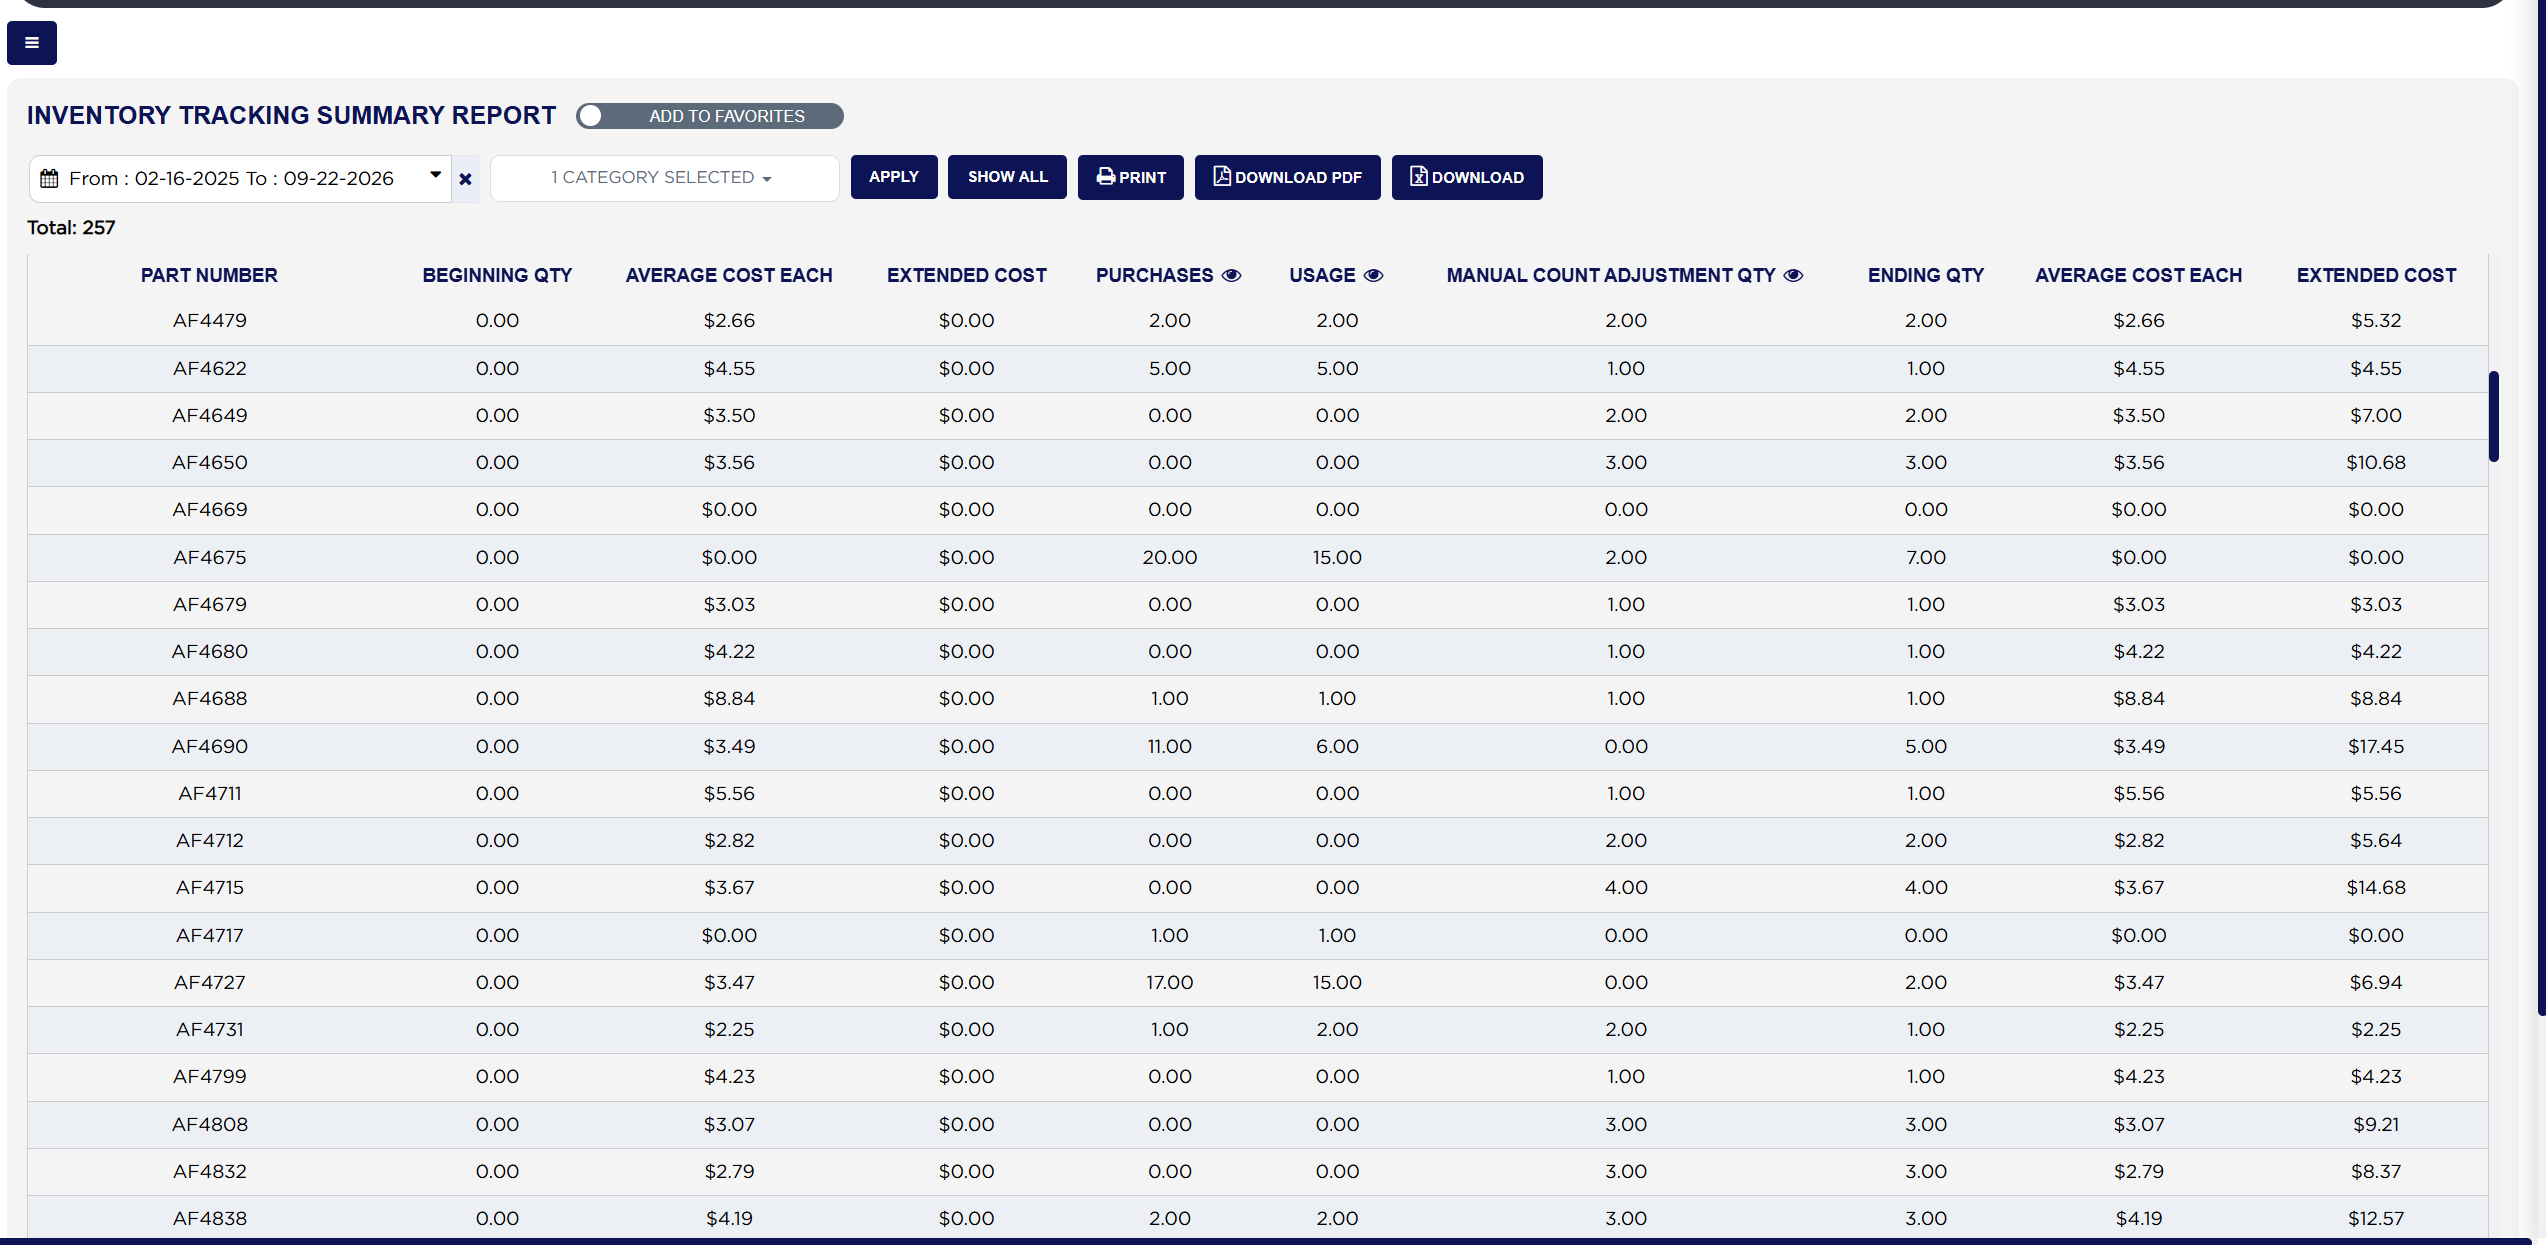
  2. Start with BEGINNING QTY, what you held on the first day of the range. Example: 0.00.
  3. Add PURCHASES, everything received from a supplier in the range. Example: 20.00, which the eye icon shows as a single delivery of 20.
  4. Subtract USAGE, everything issued to invoices in the range. Example: 15.00.
  5. Add MANUAL COUNT ADJUSTMENT QTY, the net of any manual counts applied. It can be negative. Example: 2.00.
  6. ENDING QTY is the four together: 0.00 + 20.00 − 15.00 + 2.00 = 7.00.
  7. The closing AVERAGE COST EACH is the unit cost ARM holds for the part, and the closing EXTENDED COST is the ending quantity multiplied by it. For a part ending on 6.00 at $5.59 each, the extended cost is 6.00 × $5.59 = $33.54. The opening pair works the same way against BEGINNING QTY.
Inventory Tracking Summary beginning quantity through ending quantity
About this screen

Each line shows the PART NUMBER, then the opening position, then what moved, then the closing position. BEGINNING QTY is what you held on the first day of the range, with AVERAGE COST EACH and EXTENDED COST valuing it. PURCHASES is everything received from a supplier in the range, USAGE everything issued to customers' invoices, and MANUAL COUNT ADJUSTMENT QTY the net effect of any manual counts applied. ENDING QTY is what you were left with on the last day, valued by its own AVERAGE COST EACH and EXTENDED COST. The two cost columns appear twice for that reason — the first pair values the opening quantity, the second pair the closing one. A Total: above the table counts the parts listed, and the rows are grouped under a CATEGORY: heading for each category.

Every line balances this way, which is what makes this the report to reach for when a stock figure has to be proved rather than simply read. Where a line does not look right, the three eye icons show the individual receipts, issues and adjustments that made up each column, so you can find the transaction that caused it.

The PDF uses slightly different headings for the same figures: COST EXTENDED for EXTENDED COST and END QTY for ENDING QTY.

The ADD TO FAVORITES switch beside the report title saves a shortcut to the report under your favourites in the main Reports menu.
Ask AI