Give it a long period. Over a few weeks most zip codes show a single customer, which tells you nothing about the area — a year lets the pattern appear.
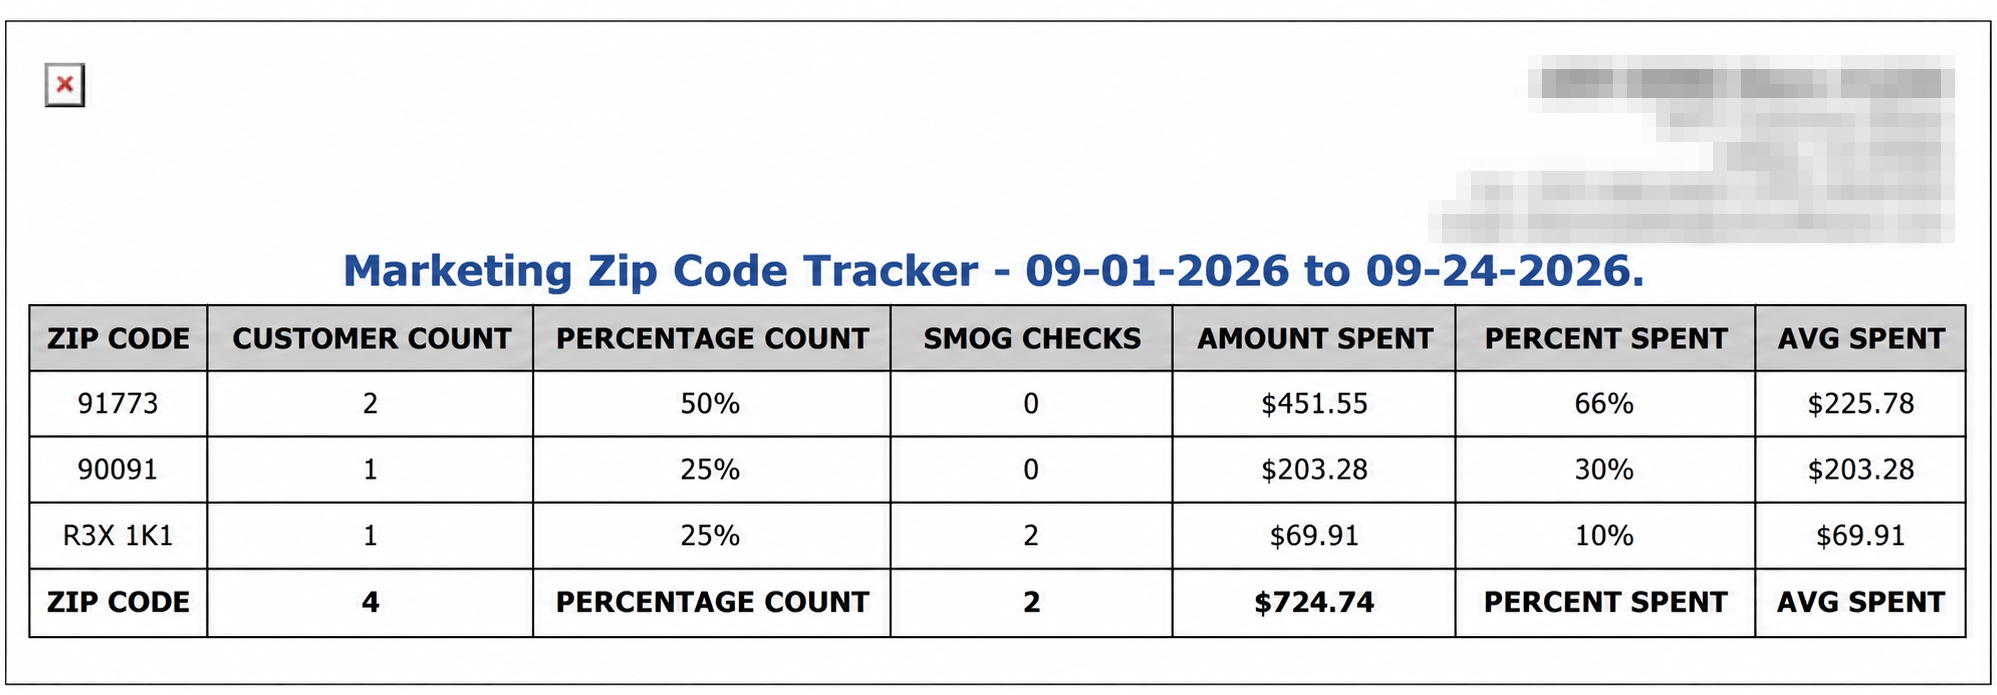
Each line shows the ZIP CODE, the CUSTOMER COUNT — the number of finalized invoices from that area — the PERCENTAGE COUNT that is of all your customers in the period, the SMOG CHECKS done for that area, the AMOUNT SPENT in total, the PERCENT SPENT that is of all your takings, and the AVG SPENT per customer.
Above the table, TOTAL: is the number of different zip codes and TOTAL AMOUNT: is the money across all of them. The footer adds up only three of the seven columns — CUSTOMER COUNT, SMOG CHECKS and AMOUNT SPENT — and leaves the other four showing their headings, because a percentage and an average have nothing useful to add up.
Two things are worth knowing before you read the numbers. Both percentage columns are rounded to whole numbers, so a column may come to 99% or 101% without anything being wrong. And the zip code is whatever is held on the customer record, so a Canadian postal code such as `R3X 1K1` sits in the list alongside 91773 — the report groups by what was typed, and a zip entered two different ways becomes two lines.
Read PERCENT SPENT from the screen rather than the printout. The two work it out from different figures, and the printed column comes out higher — in the example the screen shows 62%, 28% and 10%, adding to 100%, while the printout shows 66%, 30% and 10%, adding to 106%. Every other column on the printout matches the screen. A set of shares that adds to more than 100% cannot be right, so where the two disagree the screen is the one to quote.
A customer only counts here if a zip code is recorded against them, so an area that looks quiet may simply be an area where the zip was never entered. The ADD TO FAVORITES switch beside the report title saves a shortcut to the report under your favourites in the main Reports menu.