Enter your costs before you set the date range, not after. CALCULATE SMOG BUSINESS reloads the page from scratch, which throws away the dates you picked and puts the week setting back to six days. If you fill the boxes last you will be looking at the current month again without noticing. Costs first, then dates, then SEARCH.
If your three cost boxes come back empty after you click CALCULATE SMOG BUSINESS, the costs have not been saved. There is a fault in the current build: on a store that has never saved a set of costs, the save reports success and keeps nothing, so the boxes empty themselves on every reload and item 8 never becomes a real profit figure. You get no error message — the page simply reloads looking as it did before. If that is what you see, raise it with ARM support rather than retyping the figures; nothing you do on this screen will make them stick. Everything else on the report works normally, and items 1 to 7 and 9 to 12 are unaffected.
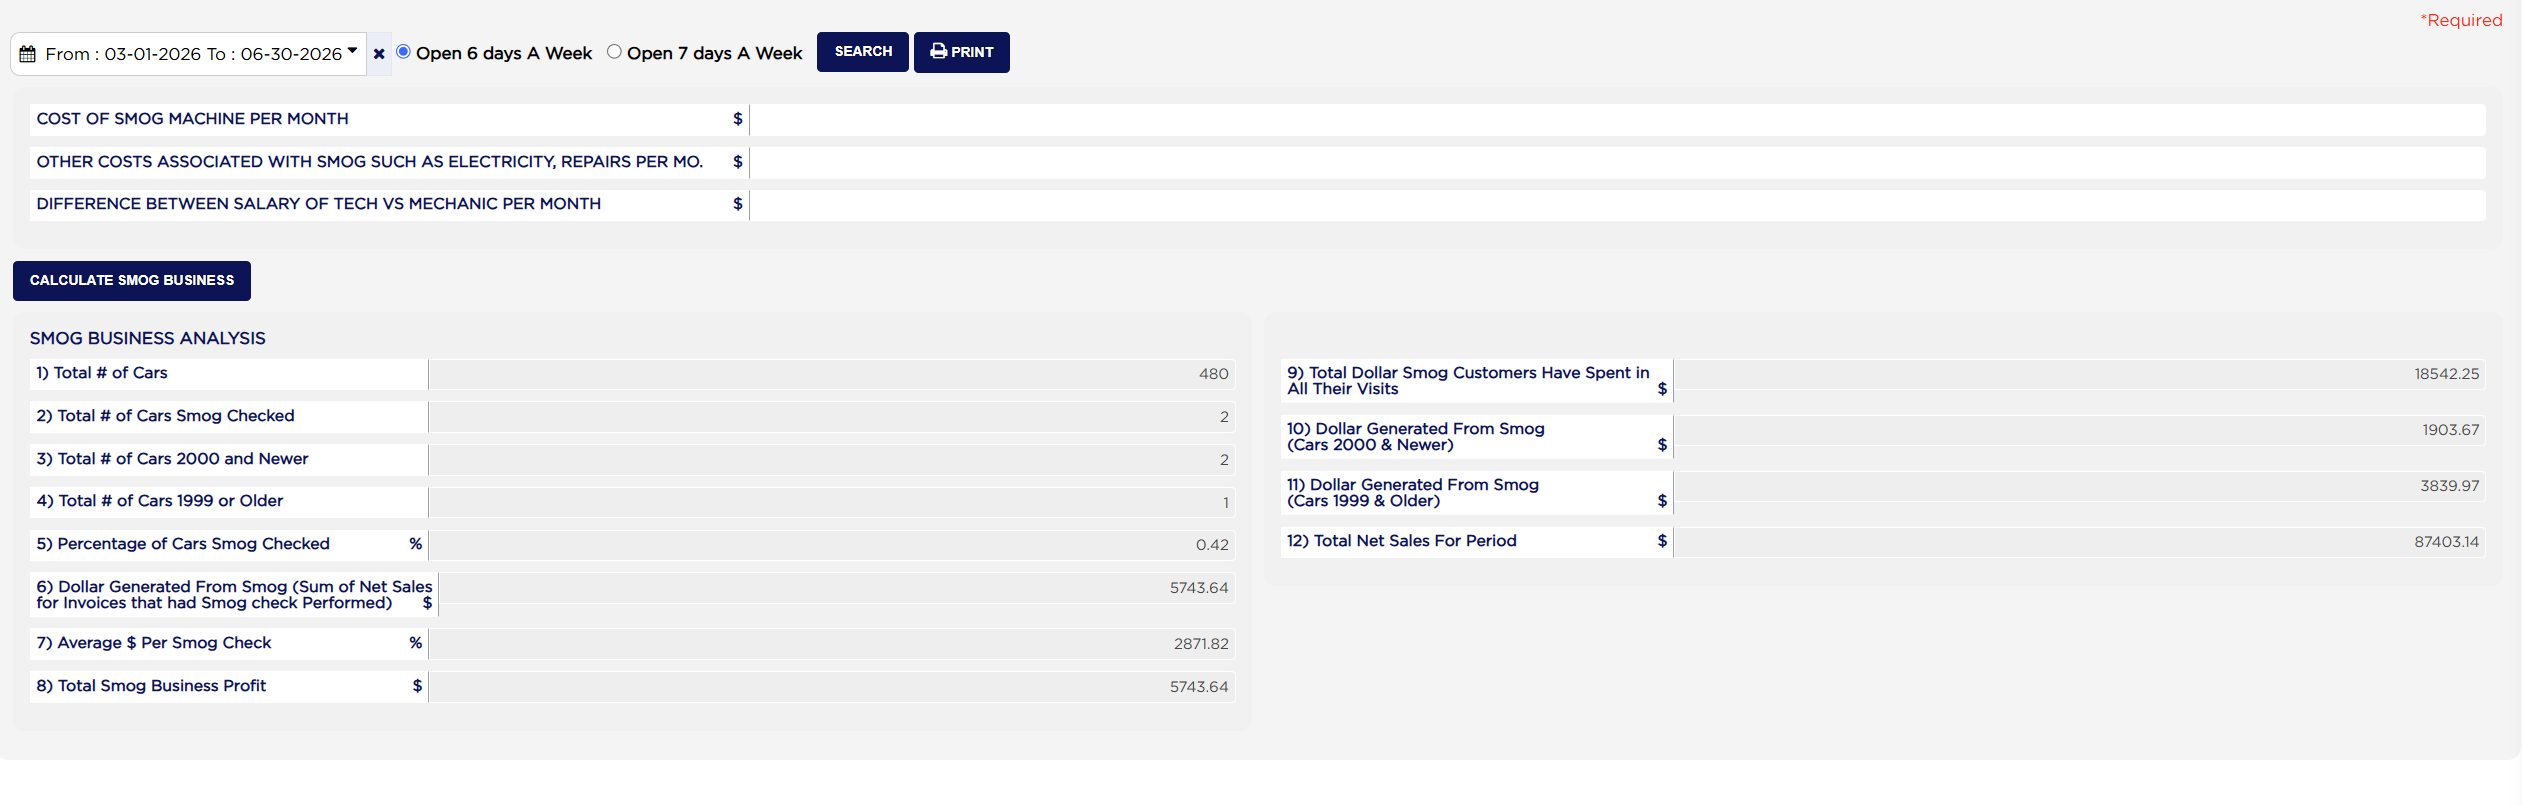
The three cost boxes are COST OF SMOG MACHINE PER MONTH, OTHER COSTS ASSOCIATED WITH SMOG SUCH AS ELECTRICITY, REPAIRS PER MO. and DIFFERENCE BETWEEN SALARY OF TECH VS MECHANIC PER MONTH. All three are monthly figures, and ARM adds them together and pro-rates the total down to the length of your period. They are also a single store-wide setting, not a record per period — there is one saved set of costs, the last one anybody typed, and it is applied to every run of the report including historical ones. If you change the machine's lease next year, last year's profit figure changes with it.
Below that come the twelve figures, in two columns under the heading Smog Business Analysis. Items 1 to 8 are on the left and 9 to 12 on the right.
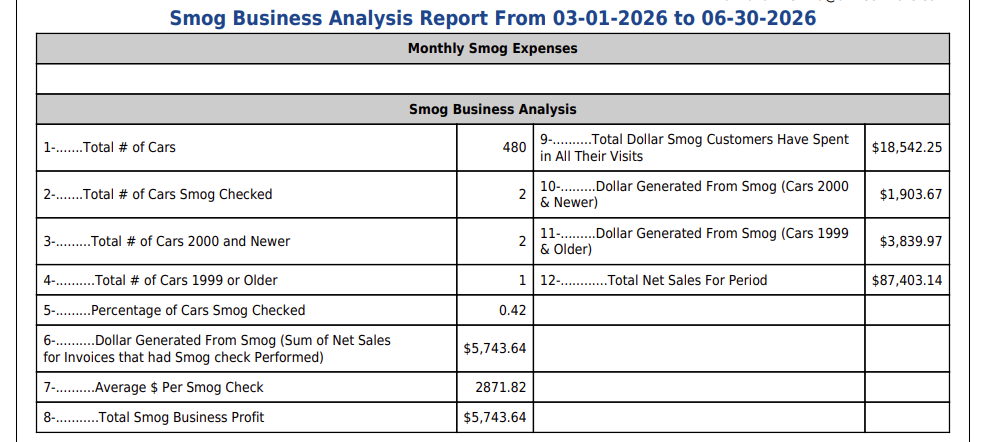
Item 1, Total # of Cars, is every finalised invoice in the period that has a vehicle on it — 480 in the example. It counts invoices, not distinct cars, so a customer who came twice counts twice, and estimates and open work orders are not in it.
Item 2, Total # of Cars Smog Checked, counts only invoices where the smog certificate was marked passed or failed. Items 3, 4, 6, 10 and 11 use a wider rule — a certificate *or* a smog service line on the invoice. That is why item 2 reads 2 in the example while items 3 and 4 come to 3 between them. See the warning below; it matters.
Items 3 and 4, Total # of Cars 2000 and Newer and Total # of Cars 1999 or Older, are not what their labels say. They do not count all your cars by age — they count the smog checked cars by age, splitting them on the vehicle year recorded against the invoice. A vehicle with no year on file appears in neither, so the two will not always add up.
Item 5, Percentage of Cars Smog Checked, is item 2 divided by item 1: 2 ÷ 480 × 100 = 0.42%.
Item 6, Dollar Generated From Smog, is the one to read carefully, and its own label tells you why: *Sum of Net Sales for Invoices that had Smog check Performed*. It is the entire net sales of every invoice that carried a smog check, not the value of the smog checks themselves. A $3,000 brake job that also got a smog check contributes all $3,000. In the example three invoices carried smog work and they were worth $5,743.64 in total.
Item 7, Average $ Per Smog Check, is item 6 divided by item 2: $5,743.64 ÷ 2 = $2,871.82. Given what item 6 actually contains, this is the average value of *an invoice that included a smog check* — not what a smog check earns. It is also overstated; see the warning below.
Item 8, Total Smog Business Profit, is item 6 less your pro-rated monthly costs and less any outside part purchases charged to those invoices. It is the report's headline, and the walk-through at the end of this document takes it apart step by step.
Item 9, Total Dollar Smog Customers Have Spent in All Their Visits, is deliberately not limited to your date range. ARM takes the customers who had smog work inside the period and then adds up everything those customers have ever spent with you, across their whole history. In the example that is $18,542.25 against $5,743.64 inside the period. It is the number that tells you what a smog customer is worth over time, which is usually the real argument for keeping the licence.
Items 10 and 11, Dollar Generated From Smog (Cars 2000 & Newer) and (Cars 1999 & Older), split item 6 by vehicle age. They reconcile exactly: $1,903.67 + $3,839.97 = $5,743.64.
Item 12, Total Net Sales For Period, is your whole store's net sales for the period — $87,403.14 in the example — so you can see what share of the business smog is bringing in.
The two counting rules do not agree, and item 7 is the casualty. Item 6's $5,743.64 came from three invoices, but item 7 divides it by item 2, which is two. The honest average is $5,743.64 ÷ 3 = $1,914.55, so the report prints a figure 50% too high. Item 5 is out the same way in the other direction: 3 ÷ 480 would be 0.63%, not the 0.42% shown. The gap opens whenever a smog job is recorded as a service line without the certificate being marked pass or fail, so if item 2 is smaller than items 3 and 4 added together, treat items 5 and 7 as unreliable and work them out yourself from item 3 + item 4.
Both units are wrong on the labels too. Item 7 is a dollar amount but carries a % sign beside its name on screen, and on the printout item 5 loses its % and item 7 loses its $ altogether. Read them by what they are, not by the symbol beside them. On screen the figures also print without a currency symbol or thousands separators — 87403.14 rather than $87,403.14 — while the printout formats them properly.
If you have never saved any costs, the Monthly Smog Expenses band prints empty — a heading with a blank row under it, as in the example — and item 8 comes out equal to item 6, because there is nothing to subtract.
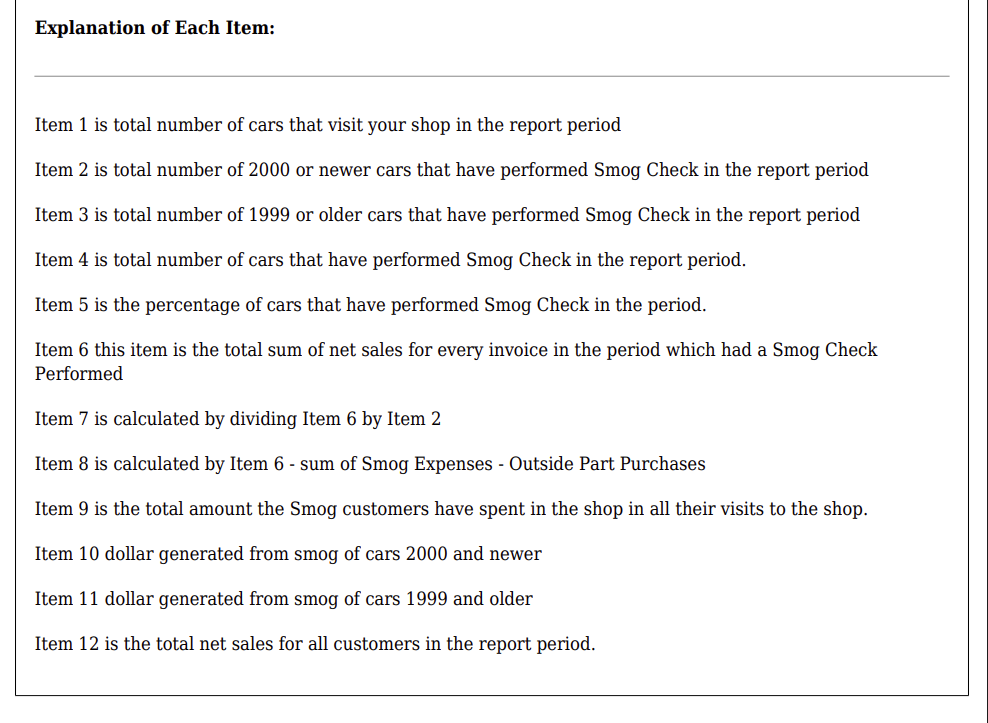
Ignore the Explanation of Each Item list at the foot of the printout. The notes for items 2, 3 and 4 have been shifted one place: the note against item 2 describes item 3, the note against item 3 describes item 4, and the note against item 4 describes item 2. The example figures show it plainly — the note beside item 4 says "total number of cars that have performed Smog Check", but item 4 reads 1 while the smog checked total is item 2, which reads 2. The descriptions in this document are the correct ones.
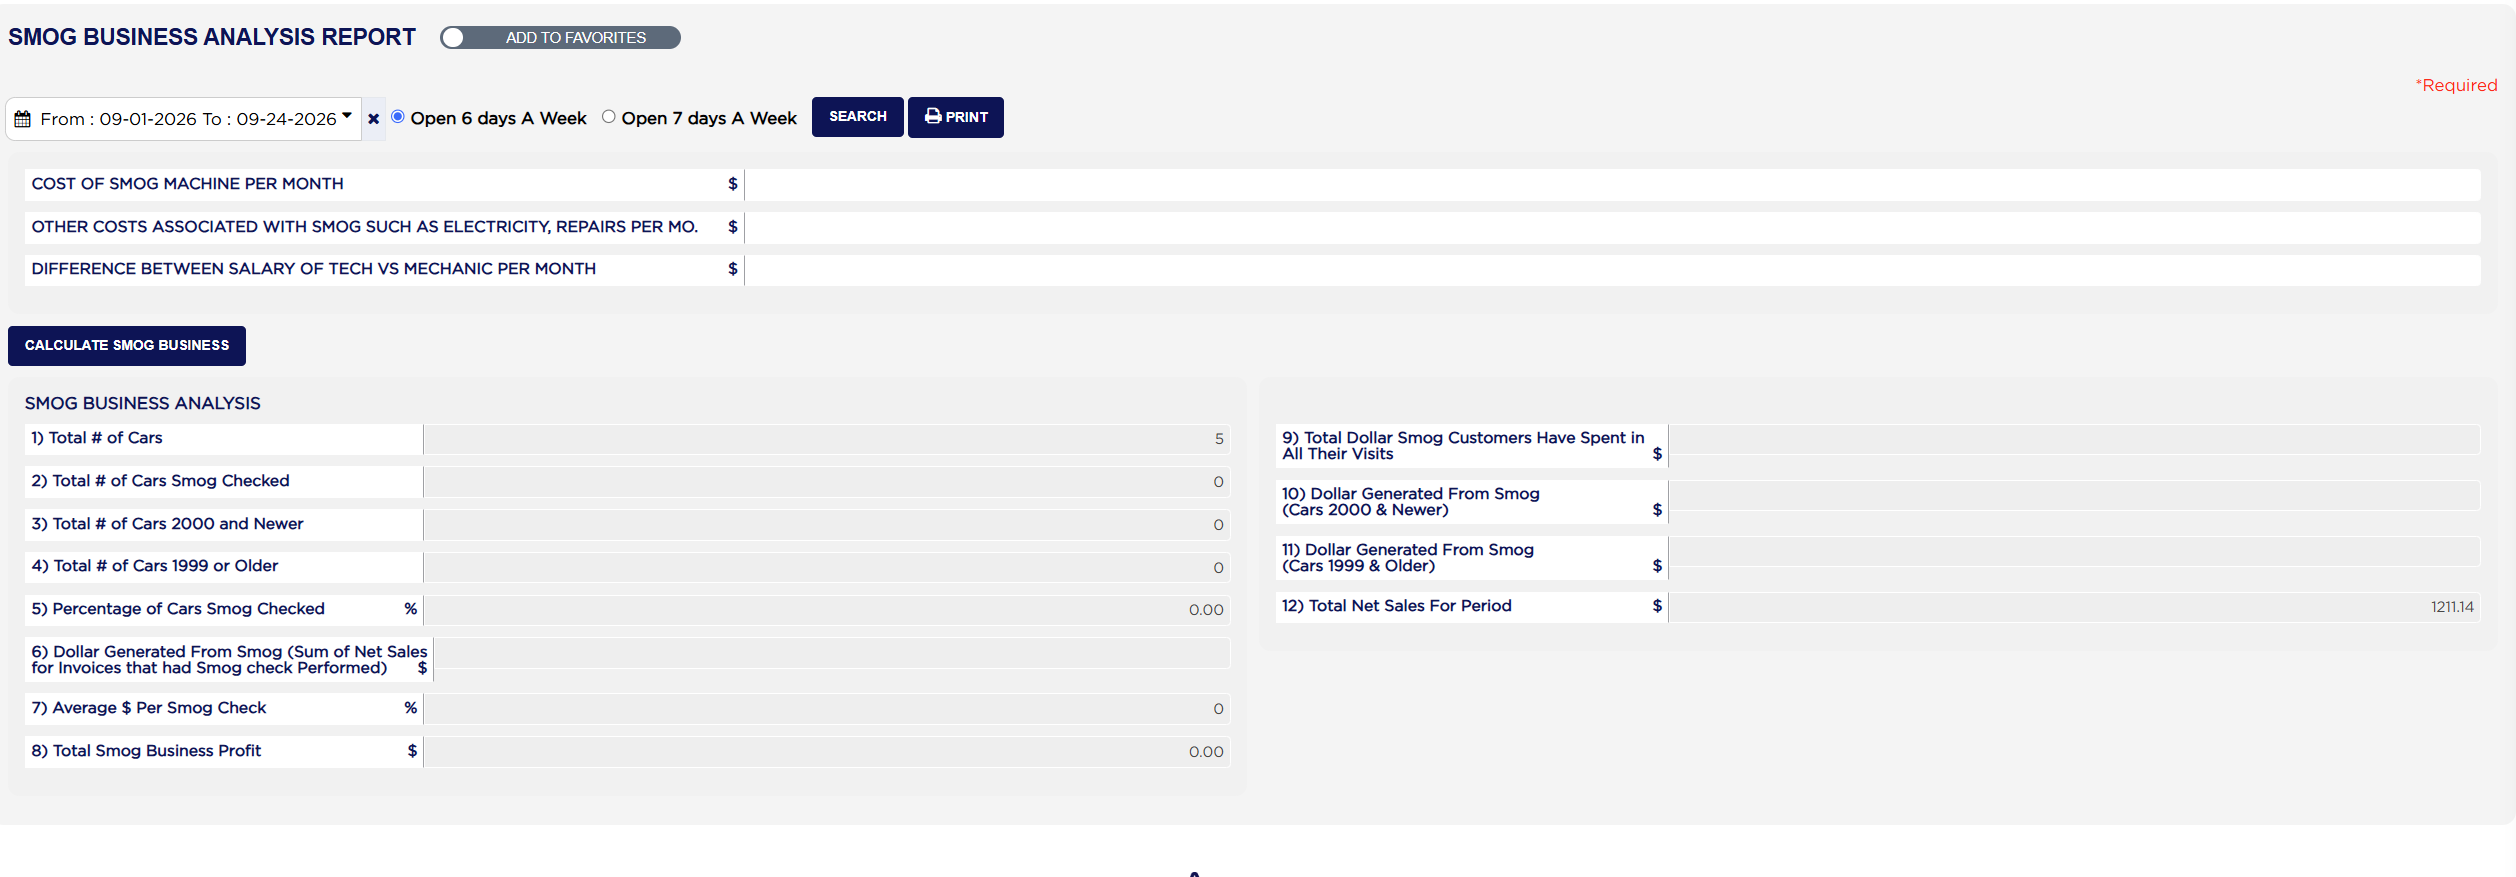
What a period with no smog work looks like. Pick a range in which nobody had a smog check and the report does not say so — it leaves half the boxes blank and fills the other half with zero. In the example below, September 2026 to date has 5 invoices and $1,211.14 in item 12 but no smog work at all, so items 1 and 12 carry figures while items 6, 9, 10 and 11 are completely empty, item 7 reads 0, and items 5 and 8 read 0.00. Three different ways of printing nothing on one screen. It is not a fault in your data and the report has not failed to load: a blank box on this screen means there was nothing to add up.
A word on the two week settings. Open 6 days A Week and Open 7 days A Week change nothing except the cost pro-rating in step 6, and only once you have saved costs — with the boxes empty both settings give an identical item 8, as the example shows. Choose the one that matches your opening hours and leave it alone; switching it between runs makes two periods look different when only the setting changed.
Two last things to know. The report will not let you look further back than your store's start date in ARM: pick an earlier From date and it quietly moves it forward to the first day ARM holds data for, so check the date box after the page reloads. And the period is measured on the date each invoice was finalised, not the date it was written, so an invoice raised at the end of one month and finalised in the next belongs to the later period.