Switching mode does not re-run the report. The two buttons only swap which date controls you can see; the figures underneath stay as they were until you choose a date. If you click CUSTOM PRIOR YEAR REPORT and read the table straight away you are still looking at your weekly result, and the other way round. Always pick a date after switching, and check that Week End/Custom Date shows what you expect before you trust the row.
In custom mode, set both ranges. ARM does not work the prior period out from the present one and does not check that they match. Leave the prior picker on its default and you can compare three months against three weeks, with every percentage on the row built from those two mismatched periods and nothing on screen to say so.
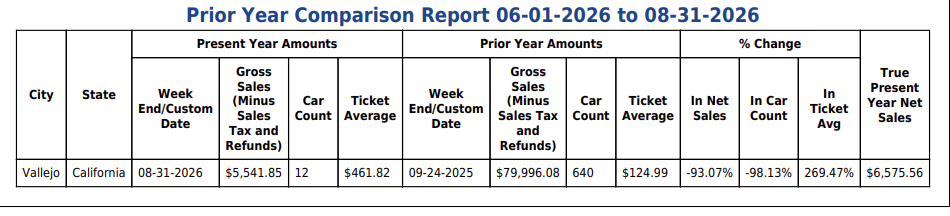
The row starts with City and State, then Present Year Amounts — Week End/Custom Date, Gross Sales (Minus Sales Tax and Refunds), Car Count and Ticket Average. Prior Year Amounts repeats the same four for the comparison period. Then come three % Change columns — In Net Sales, In Car Count and In Ticket Avg — and finally True Present Year Net Sales.
Gross Sales (Minus Sales Tax and Refunds) is your sales with the tax taken out. Despite the heading, refunds are not deducted from it. If refunds matter to you, use Prior Year Comparison After Refund Report instead — that report adds a Net Refund Sales and a Net Final Sales column and shows you what was actually kept.
Ticket Average is that column divided by Car Count. In the example $5,541.85 ÷ 12 = $461.82, and on the prior year $79,996.08 ÷ 640 = $124.99.
Each % Change column is this year divided by last year, less one. In Net Sales is −93.07%, which is $5,541.85 against $79,996.08; In Car Count is −98.13%, which is 12 against 640; In Ticket Avg is 269.47%, which is $461.82 against $124.99. A positive figure means this period beat the comparison period.
True Present Year Net Sales is a second, different measure of the same period. It is the net sales ARM stores against the invoices themselves, and it will not usually match the Gross Sales (Minus Sales Tax and Refunds) figure at the start of the row — in the example $6,575.56 against $5,541.85. The two are built differently: one comes straight off the invoice record, the other is worked out from gross sales less tax. Nothing on the row is wrong; they are simply two answers to slightly different questions, and this column lets you see both.
Weekly mode compares to 52 weeks back, not to the same date last year. Pick Saturday 06-27-2026 and the prior-year column shows 06-28-2025 — 364 days earlier. That is deliberate: it lines a Saturday up against a Saturday so you compare a full trading week with a full trading week, which a calendar year cannot do.
A period with no trade shows as zeros and −100.00%. In the weekly example above the chosen week had no invoices at all, so the present-year figures read $0.00 and 0, True Present Year Net Sales reads $0.00, and all three change columns read −100.00% against a prior week that took $20,364.79 from 188 cars. That is the report working correctly, not a loading failure — but it is worth knowing before you conclude the business has collapsed.
The printout carries the same twelve columns and matches the screen. Click PRINT and the PDF opens in a new tab, headed with your store details and the report name followed by your present-year dates. The headings wrap onto several lines to fit the row on one page; every figure is the figure you were looking at.
A note on the three prior-year reports. This one is the plain comparison. Prior Year Comparison After Refund Report adds what you refunded and what you kept after it. Net sales/Car count/Ticket average Prior Year Comparison Report adds a cars-per-day block instead. All three are built from the same figures, so the columns they share will agree.