ARM Help

Gross Profit (Finalized) Report

The Gross Profit (Finalized) Report shows how much margin each package made over a date range, one line per package, grouped under the service class the package belongs to. For every package sold on a finalized invoice in the range it adds up what was charged for parts and for labor, takes off the cost of the parts that came from inventory, and shows the gross profit in dollars and as a percentage of the sale. It answers which services carry the shop and which are sold too cheap. Use it to review pricing on a package whose margin is below target, to compare service classes such as brakes against oil changes, and to see where the week's profit actually came from.

4 how-to answers 2 screenshots Open in ARM Markdown

How do I run the Gross Profit (Finalized) Report? #

  1. From the Home Screen, click Reports → Management & Operational Reports → Gross Profit (Finalized) Report.
  2. Click the From : … To : … date box and pick the first and last day of the period; the report counts invoices by their finalized date. It opens on the current week, Monday to Sunday. The × beside the box clears the dates.
  3. To limit the list to one service class, pick it in Select Service; the report reloads at once. Leave it on Select Service to include every class.
  4. To find one package, type its name into Search Package and pick it from the suggestions that appear, or type the full name and click Search.
  5. Click Search to load the report. Click Show All to clear every filter and return to the current week.
  6. Click SERVICE NAME or PACKAGE NAME in the heading to sort by that column; click it again to reverse the order. Longer lists are split into pages with page links under the table.
  7. Click Print for a PDF copy in a new tab. The button appears only when the report has rows.
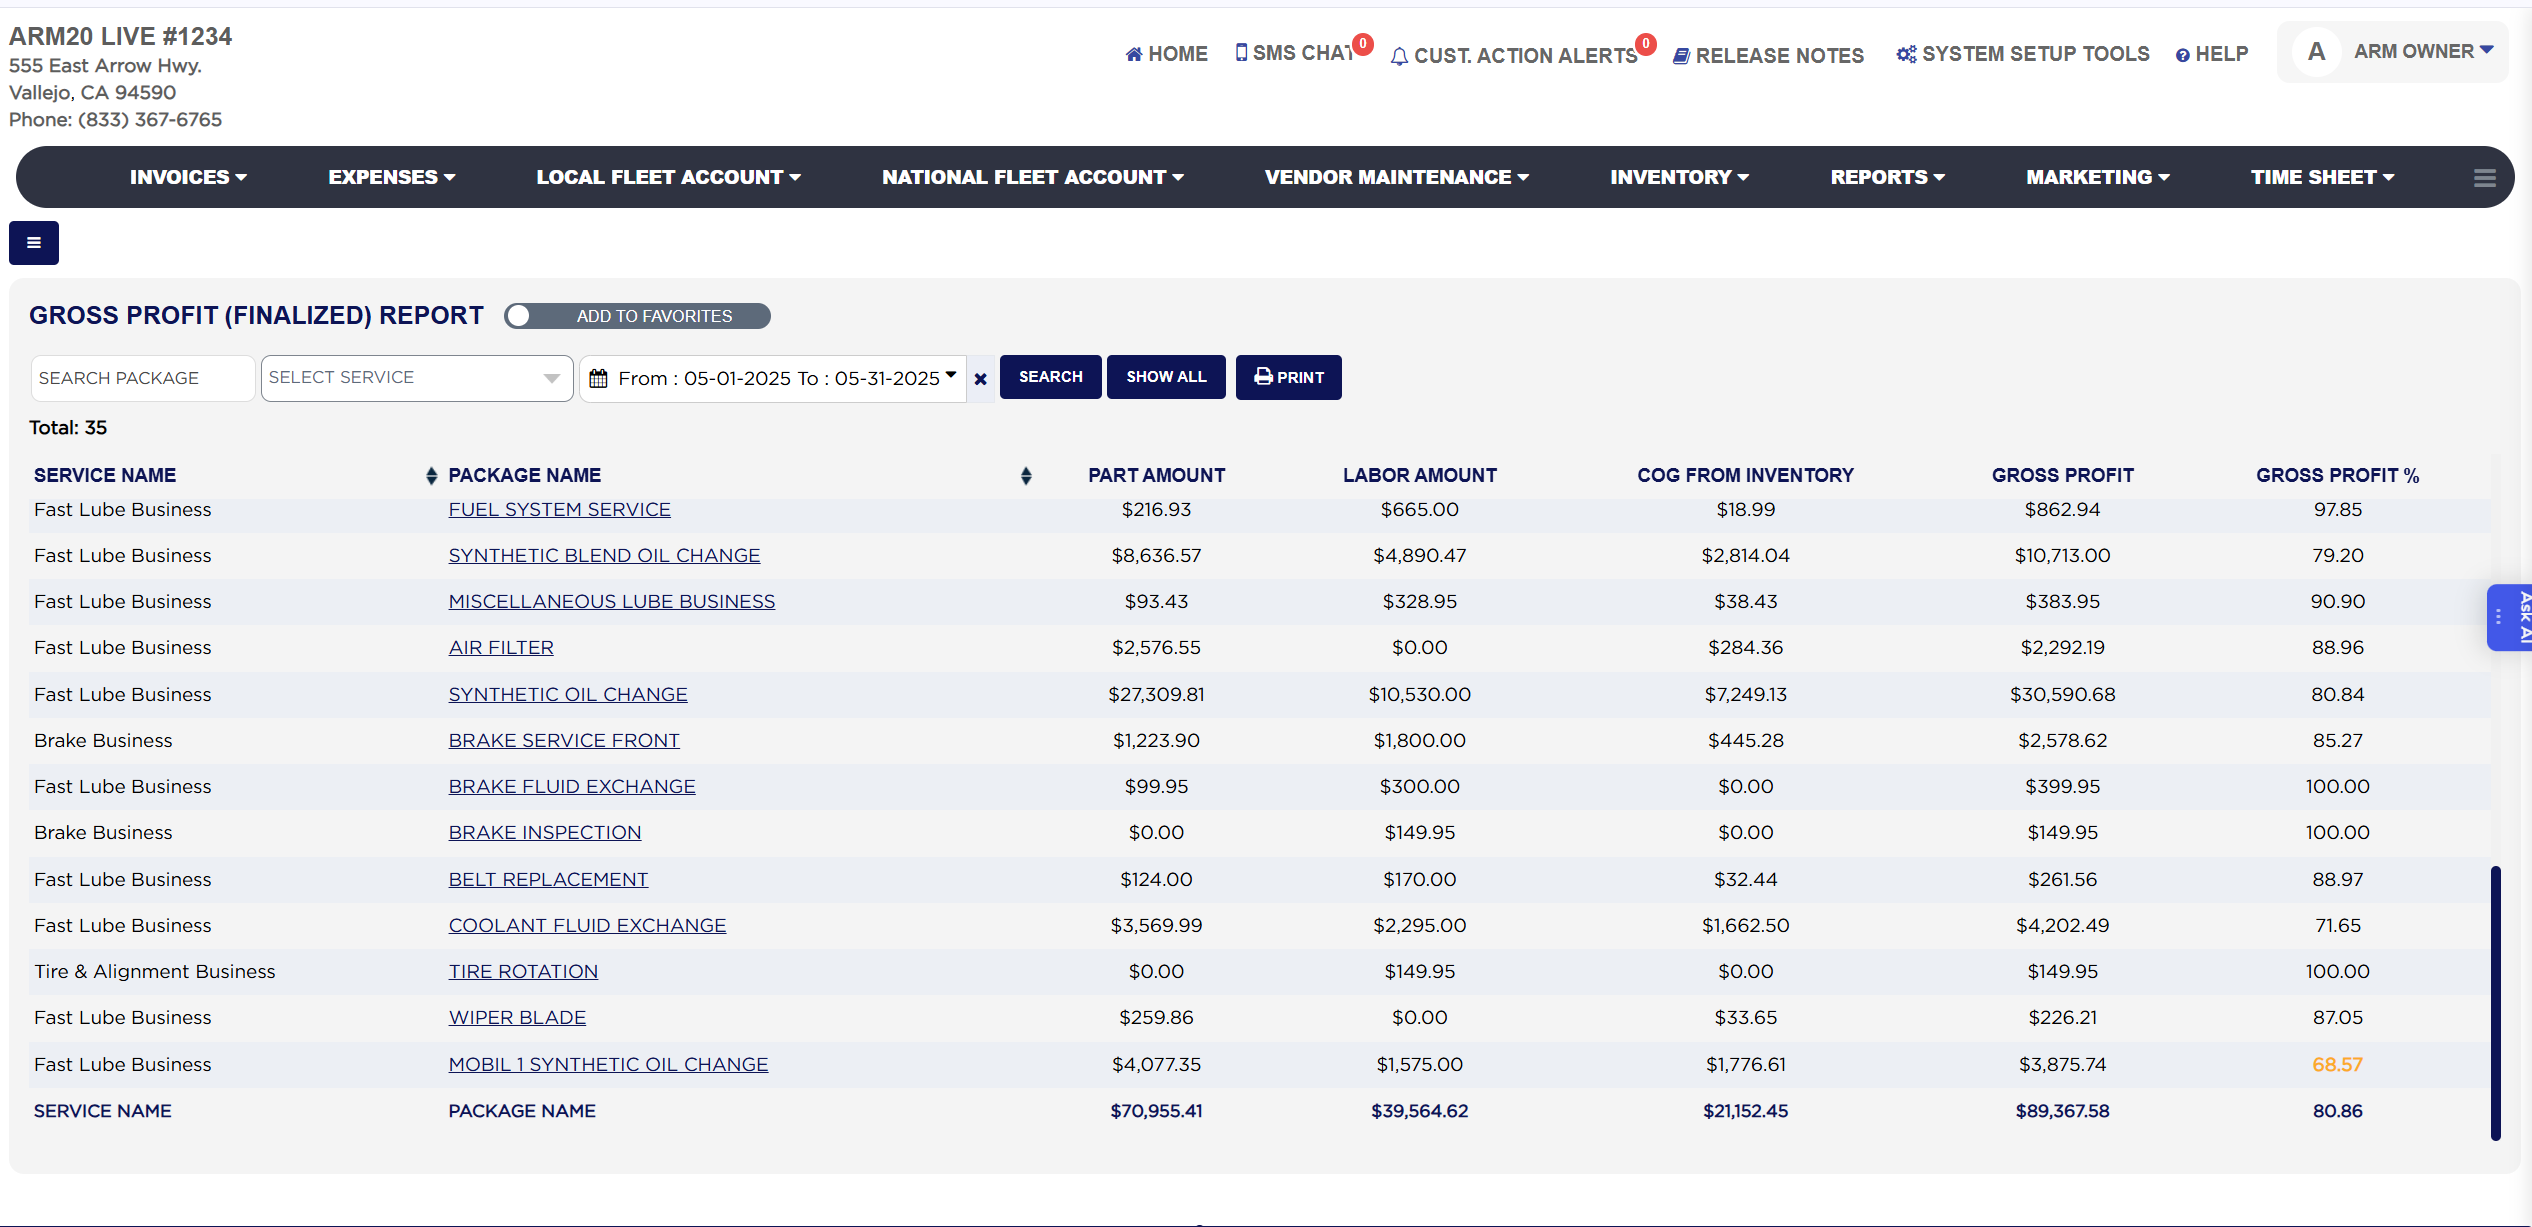
Gross Profit (Finalized) Report with filters, results and totals row

How do I see the invoices behind a package's gross profit? #

  1. From the Home Screen, click Reports → Management & Operational Reports → Gross Profit (Finalized) Report, and run the report for your date range.
  2. Click the underlined PACKAGE NAME. The Gross Profit Detail Report opens in a new tab, already filtered to that package and the same dates, and lists every invoice the package was sold on with its own part amount, labor amount, purchase cost and gross profit.
  3. Close the tab to return to the summary.

How do I find the packages with the weakest margin? #

  1. From the Home Screen, click Reports → Management & Operational Reports → Gross Profit (Finalized) Report.
  2. Set From : … To : … to a full month so each package has enough sales to judge, and click Search.
  3. Look down the GROSS PROFIT % column for the orange and red figures. Compare the package's PART AMOUNT with its COG FROM INVENTORY: a small gap between them means the parts are priced too close to cost.

How do I work out a package's gross profit from the report line? #

  1. From the Home Screen, click Reports → Management & Operational Reports → Gross Profit (Finalized) Report, run it for your date range and pick one package line.
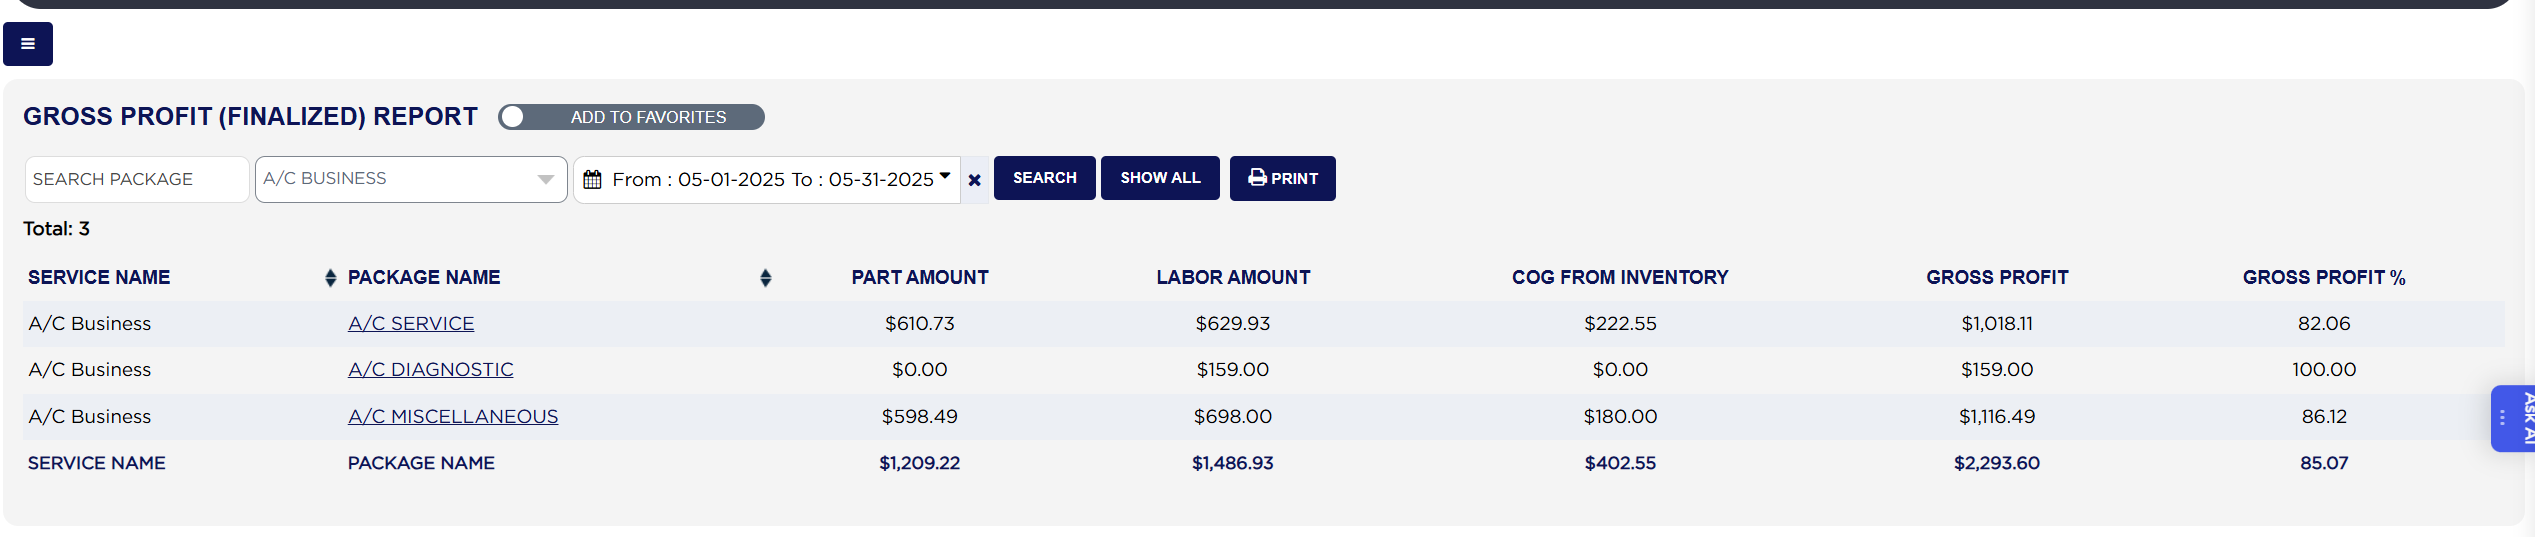
  2. Start with PART AMOUNT: ARM adds up the part charge of every part line sold on that package, on every finalized invoice in the range. Example: three brake jobs with parts of $180.00, $210.00 and $210.00 give $600.00.
  3. Add LABOR AMOUNT: the labor charge of every labor line on the same package on the same invoices. Example: $120.00 on each job gives $360.00, so parts and labor together are $960.00.
  4. Take COG FROM INVENTORY: for each part line, the purchase cost recorded on the part multiplied by the quantity sold, added up. Example: pads costing $65.00 a set, one set per job, give $195.00.
  5. GROSS PROFIT is parts plus labor less cost of goods: $960.00 − $195.00 = $765.00.
  6. GROSS PROFIT % is gross profit divided by parts plus labor, times 100: $765.00 ÷ $960.00 × 100 = 79.69. Because it is above 70 it prints in black; between 50 and 70 it would print orange, below 50 red. Labor has no cost in this report, so a package with a lot of labor shows a high percentage even when its parts are sold at cost.
  7. The foot row does the same sums over every line: total parts, total labor, total cost of goods, total gross profit, and the overall percentage from those totals rather than an average of the line percentages.
Gross Profit (Finalized) Report one package line used in the calculation example
About this screen

Total: above the table is the number of packages listed. Each line shows the SERVICE NAME (the service class the package is filed under), the PACKAGE NAME, the PART AMOUNT charged for parts on that package across all the invoices in the range, the LABOR AMOUNT charged for its labor lines, the COG FROM INVENTORY (cost of goods: the purchase cost of each part multiplied by the quantity sold), the GROSS PROFIT (part amount plus labor amount, less cost of goods) and the GROSS PROFIT %, which is the gross profit divided by the part and labor amount together. The percentage turns orange when it falls below 70 and red when it falls below 50, so a package that needs a price review stands out. Only finalized invoices count; drafts, voided and deleted invoices are left out. The foot row repeats the headings and sums the part, labor, cost of goods and gross profit columns, with the overall gross profit percentage for the range.

The Add To Favorites switch beside the heading saves the report under Favorites on the Reports page. Which reports you see depends on your admin group permissions.
Ask AI