ARM Help

Employee Service Sales & Performance Report

Employee Service Sales & Performance Report shows what each member of staff sold and what they worked on, service by service, and turns both into a rate per hour on the clock. It gives every employee their own table, one line per service your shop offers, and splits each line two ways — what they sold as the salesperson, and what they did as the technician. Use it to see which services somebody is good at selling, to compare selling against doing, and to work out what an hour of a person's time returns.

3 how-to answers 6 screenshots Open in ARM Markdown

How do I run the Employee Service Sales & Performance Report? #

  1. From the Home Screen, click Reports → Employee & Payroll Reports → Employee Service Sales & Performance Report.
  2. Pick a name in Employee Name, or leave it on All Employees to get a table for everybody.
  3. Click the Finalize Date box and pick the period. Work is picked up by the date the invoice was finalized.
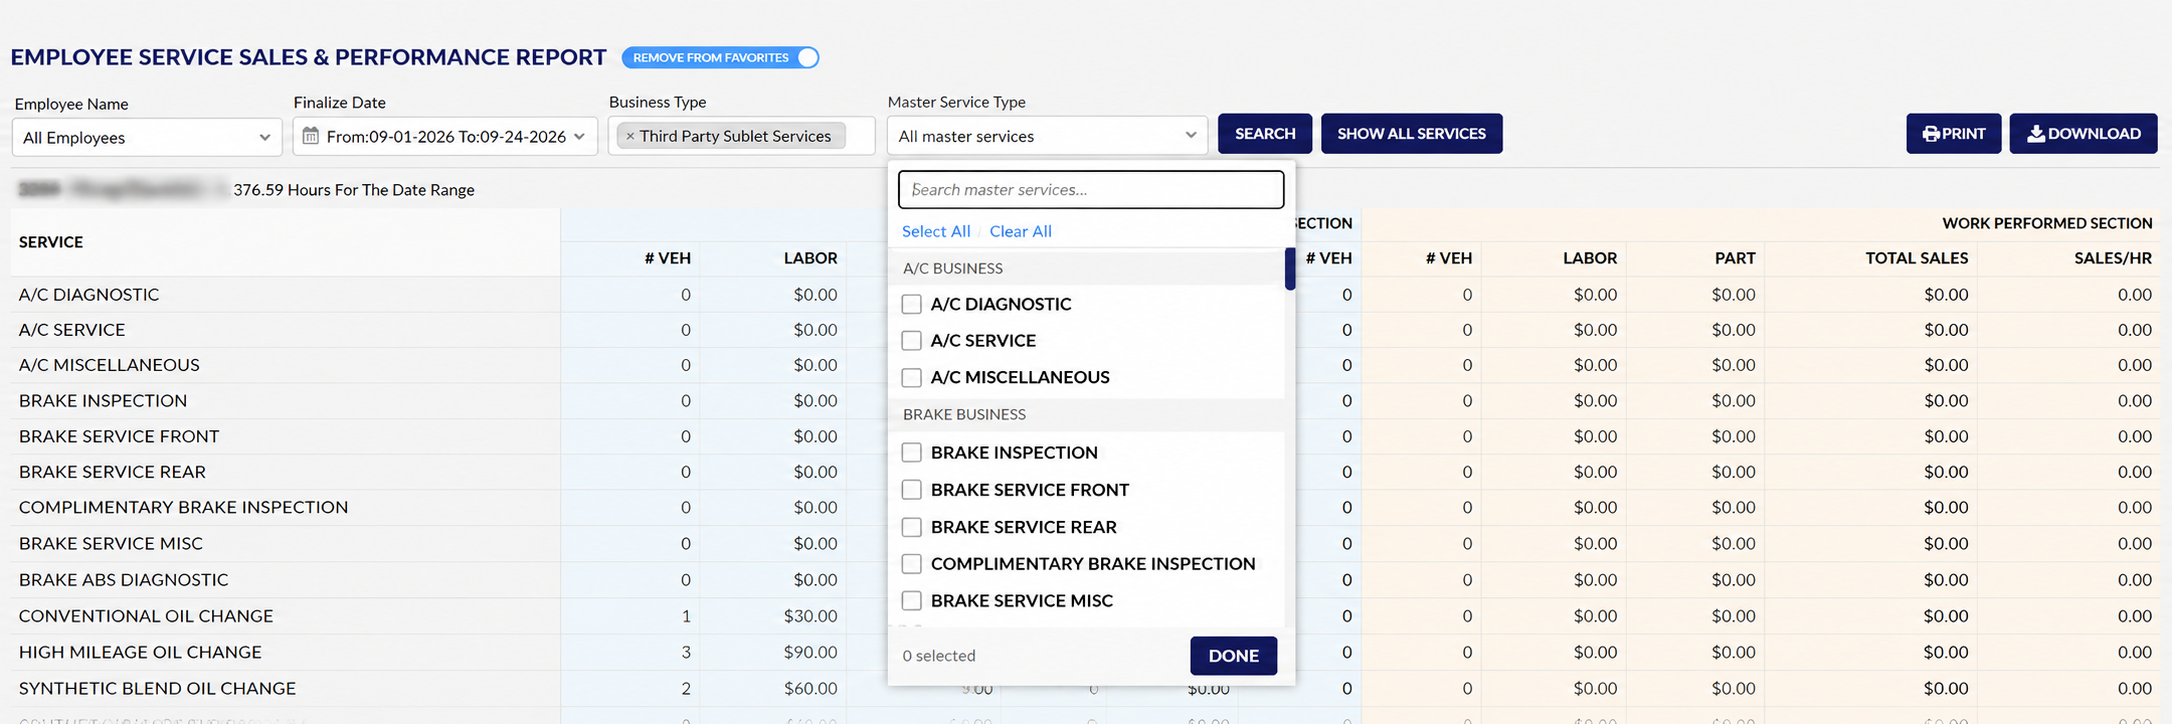
  4. Narrow the services if you want to. Business Type takes more than one choice at a time, each appearing as a tag you can remove with its ×. Master Service Type opens a panel where you can search, tick individual services grouped under their business, use Select All or Clear All, and click DONE when you have finished.
  5. Click SEARCH to load the report. SHOW ALL SERVICES clears the service filters and brings the whole list back.
  6. Click PRINT for a PDF copy or DOWNLOAD to export to a spreadsheet.
Employee Service Sales and Performance Report filters
Employee Service Sales and Performance Report print output

How do I work out sales per hour for a service? #

  1. From the Home Screen, click Reports → Employee & Payroll Reports → Employee Service Sales & Performance Report, run it for your date range and pick one employee's table.
  2. Read the hours from the line above the table — the figure in *‹n› Hours For The Date Range*. This is the employee's total time on the clock for the whole period, not time spent on any one service. Example: 376.59 hours.
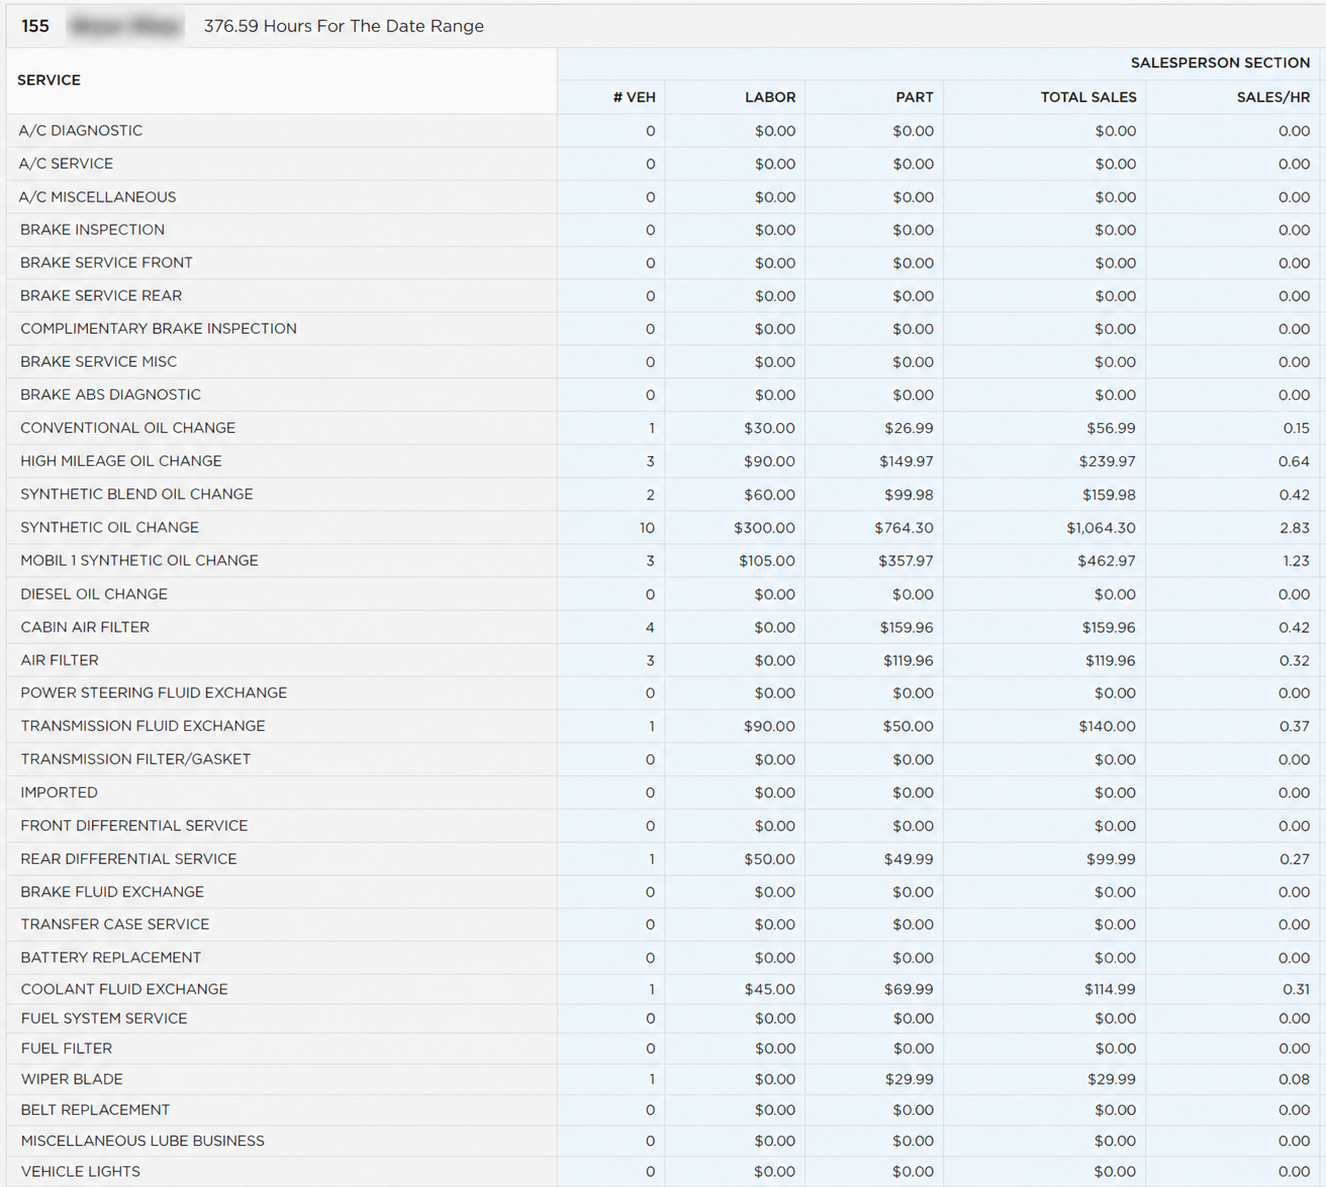
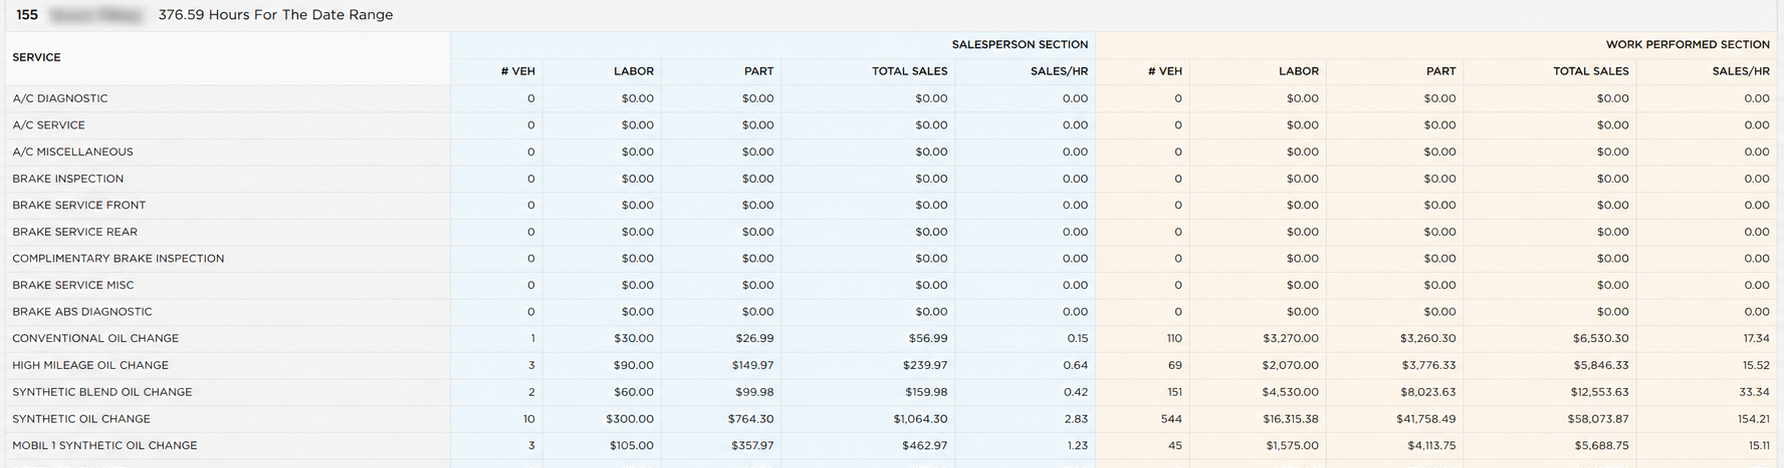
  3. Pick a service line and read LABOR and PART in whichever group you are interested in. Example, Conventional Oil Change in the salesperson group: $30.00 of labor and $26.99 of parts.
  4. TOTAL SALES is the two added together. Example: $30.00 + $26.99 = $56.99.
  5. SALES/HR is that figure divided by the employee's hours. Example: $56.99 ÷ 376.59 = 0.15.
  6. Do the same on a bigger line to see it move. Synthetic Oil Change sold $1,064.30, and $1,064.30 ÷ 376.59 = 2.83.
  7. Every line on the table divides by the same hours, so SALES/HR reads as *what this service contributed for each hour the employee was on the clock* — not as how productive they were while doing that service. Add the SALES/HR figures down a group and you get the group's total rate.
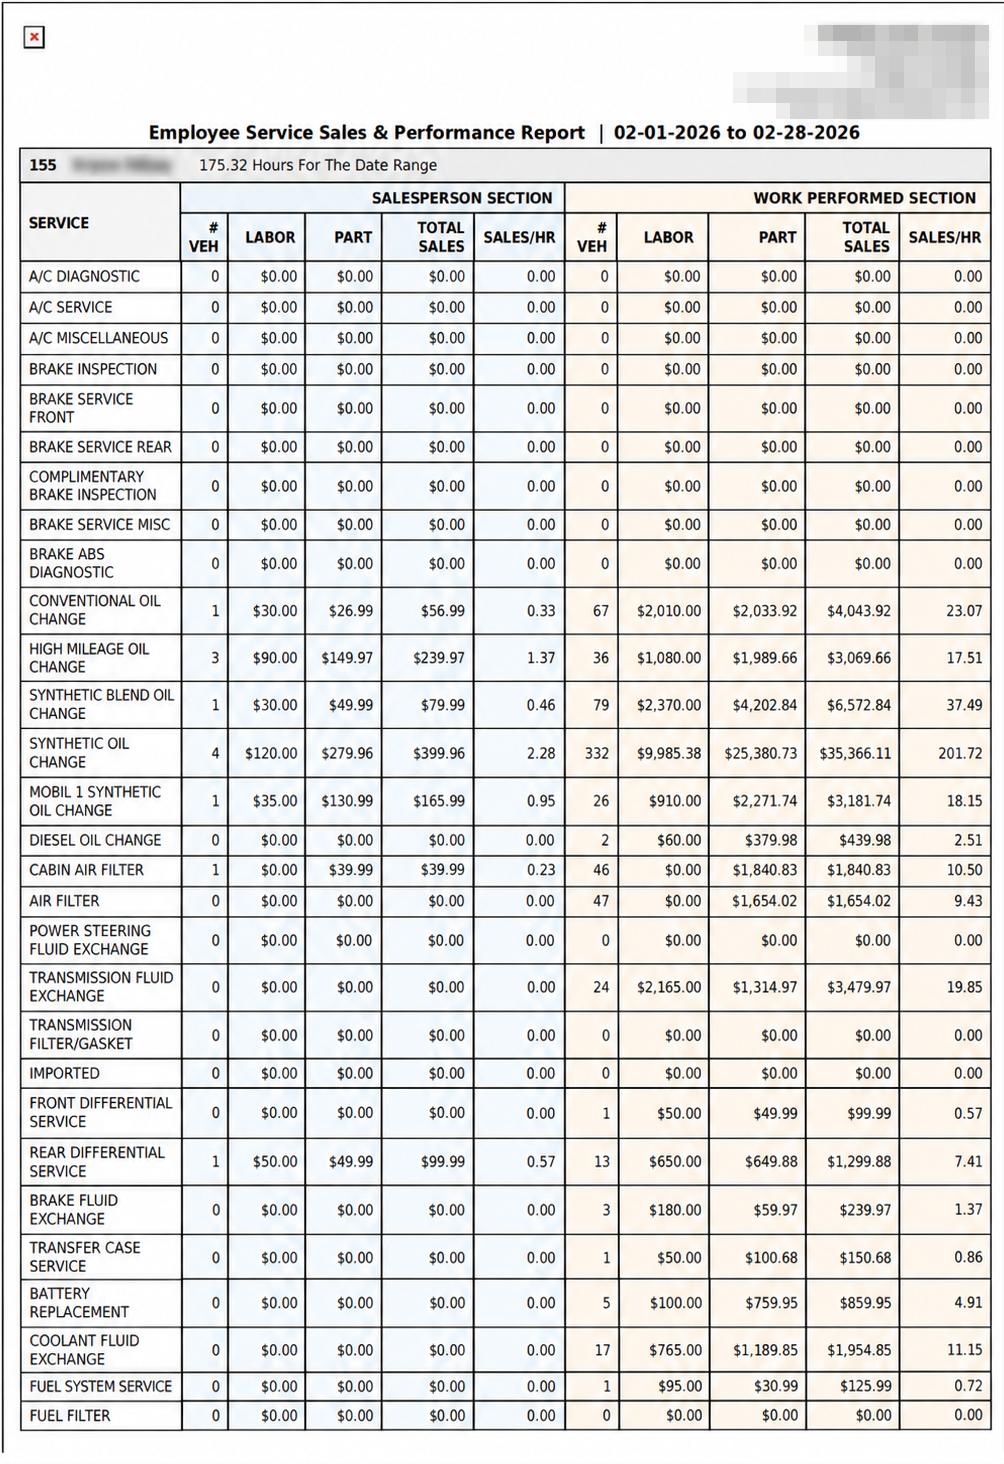
  8. It follows that the same money over fewer hours reads higher. The same $56.99 of Conventional Oil Change in a period where the employee worked 175.32 hours shows 0.33 rather than 0.15.
Employee Service Sales and Performance Report salesperson section
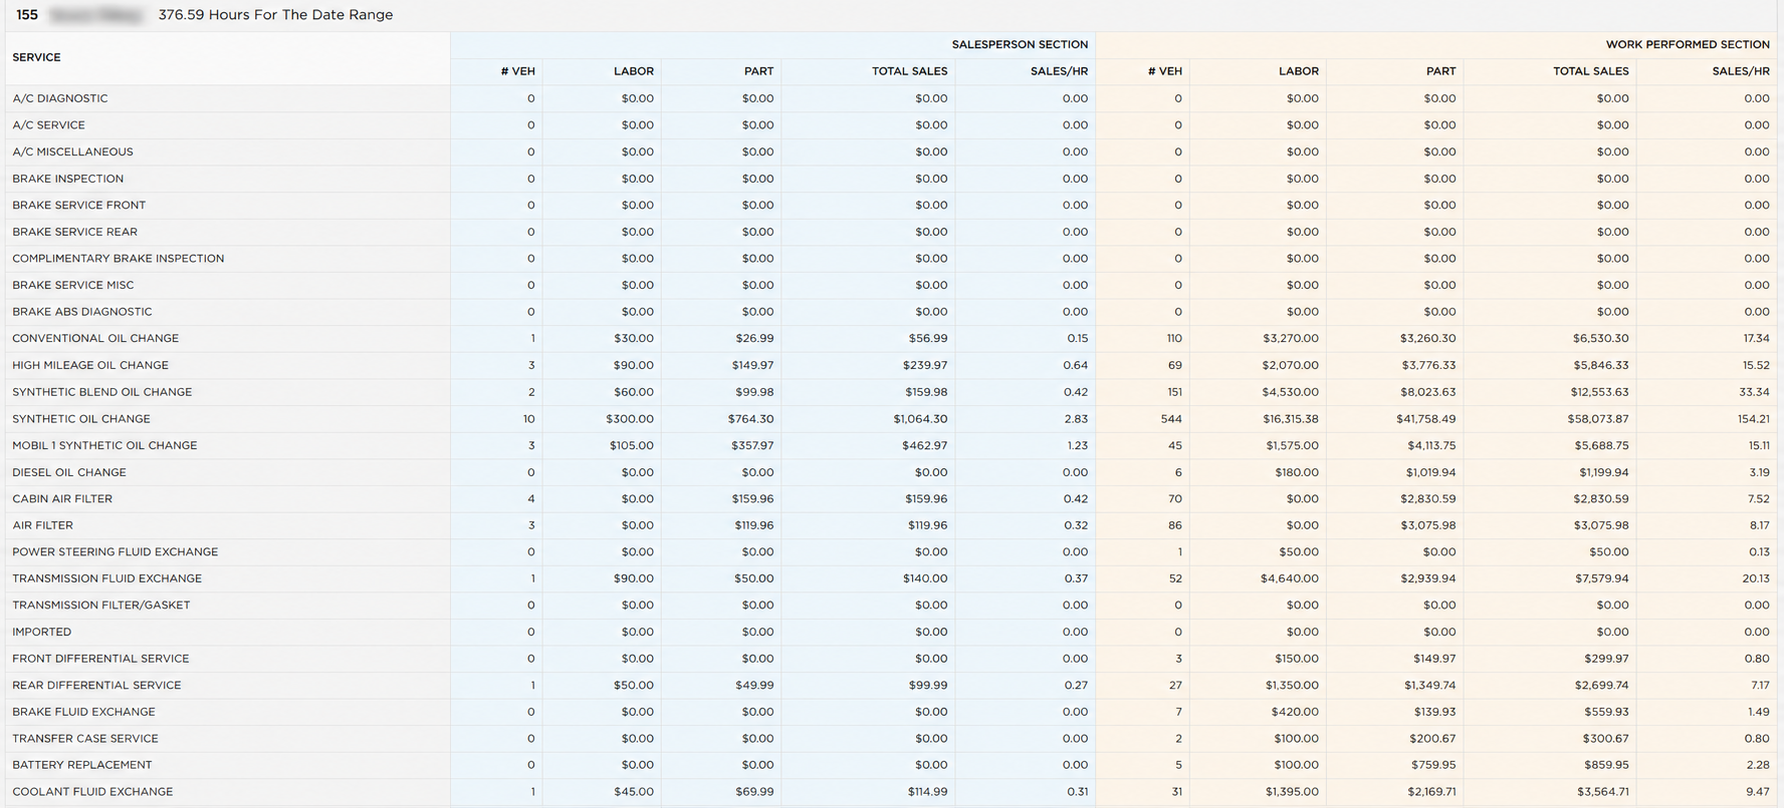
Employee Service Sales and Performance Report salesperson and work performed sections
Employee Service Sales and Performance Report rows used in the calculation example

How do I print a period for an employee? #

  1. From the Home Screen, click Reports → Employee & Payroll Reports → Employee Service Sales & Performance Report, set the filters and click SEARCH.
  2. Click PRINT. The PDF opens in a new tab, headed Employee Service Sales & Performance Report with the date range beside it, a page per employee.
  3. Each page repeats the employee number, name and hours, then the same two column groups and the same TOTALS: row as the screen.
Employee Service Sales and Performance Report totals row
About this screen

Each employee's table opens with a line giving their employee number, their name, and the hours they were on the clock over the period — *376.59 Hours For The Date Range*. That hours figure is the one every SALES/HR on their table is worked out from, so it is worth reading before anything else.

The table itself is one wide table with the services down the left and two groups of columns side by side, not two separate tables. The blue SALESPERSON SECTION on the left is what this person sold; the orange WORK PERFORMED SECTION on the right is what they actually did. Both carry the same five columns: # VEH, the number of vehicles; LABOR and PART, the money in each; TOTAL SALES, the two added together; and SALES/HR.

Reading a line across both groups is the point of the report. A service with figures on the left and nothing on the right is one this person sells but does not work on; figures on the right and nothing on the left means they do the work and somebody else sells it. A service can be worth far more on one side than the other — in the example, Synthetic Oil Change shows 10 vehicles and $1,064.30 sold against 544 vehicles and $58,073.87 worked.

The TOTALS: row at the foot runs across both groups, adding the vehicles and the money for every service and working the rate from the totals in the same way.

Every service your shop offers gets a line whether or not the employee touched it, so most tables carry a long run of zeros — the list is the full master service list, not just the work they did. The ADD TO FAVORITES switch beside the report title saves a shortcut to the report under your favourites in the main Reports menu.
Ask AI