ARM Help

Report of OPP of Stocking Parts

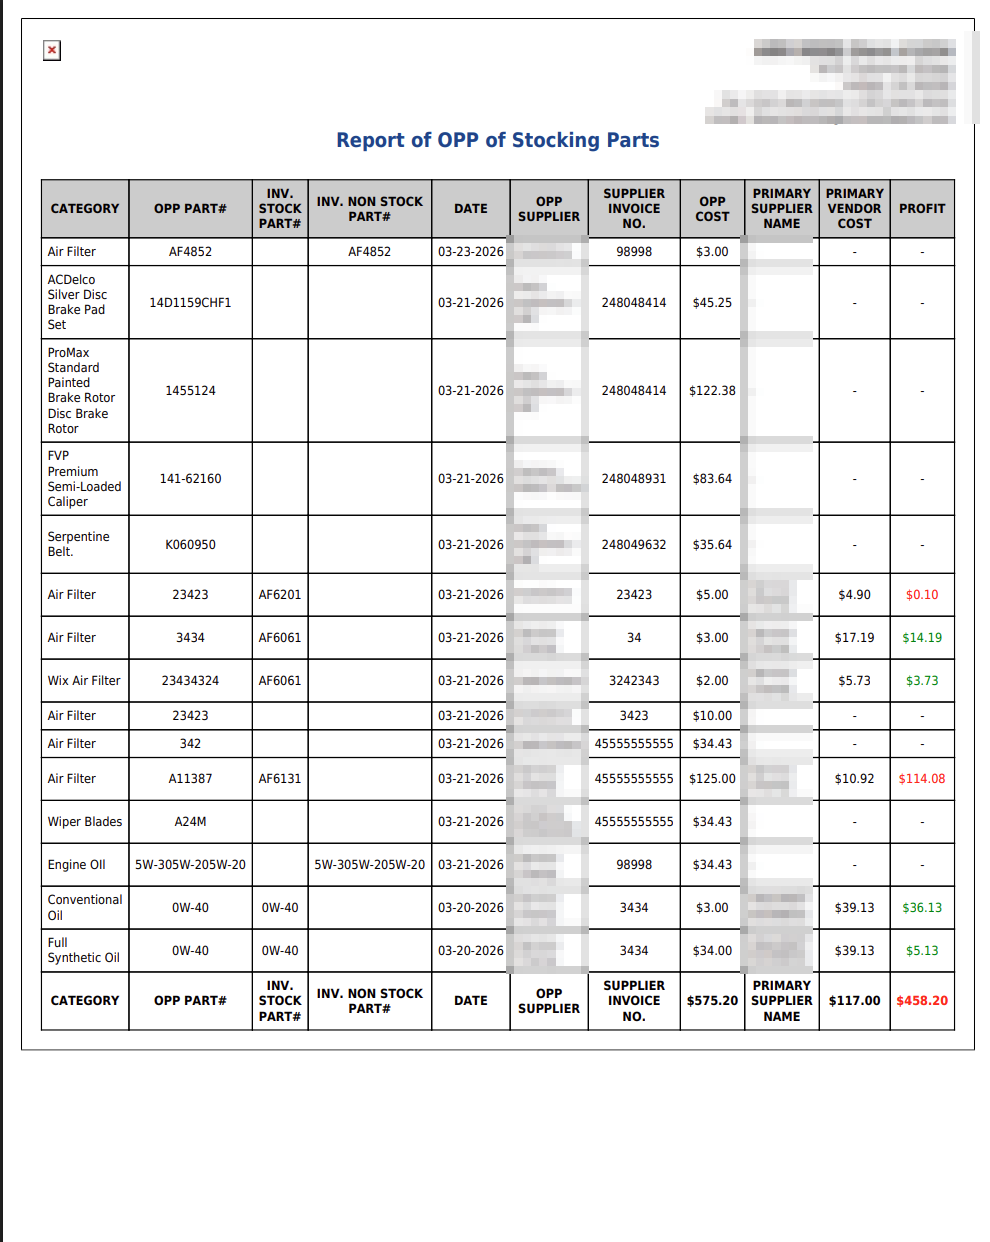
Report of OPP of Stocking Parts lists the outside part purchases (OPP) for a period, one line per part bought in. For a part you also stock in inventory, it compares what you paid the outside supplier with what your regular stocking vendor charges. It shows when the shop bought outside a part it could have taken from its own supply chain, and whether that cost more or less. Use it to find parts worth keeping in stock, and to check whether buying outside is costing money.

3 how-to answers 6 screenshots Open in ARM Markdown

How do I run the Report of OPP of Stocking Parts? #

  1. From the Home Screen, click Reports → Shop Expenses & Vendor Reports → Report of OPP of Stocking Parts. The page is headed OPP STOCKING PARTS REPORT.
  2. Set the date range in the From / To selector. It opens on the first of this month to today, and the report loads as soon as you choose the dates.
  3. SHOW ALL reloads the report for the dates chosen. There is no search box on this report.
  4. Click any column heading with arrows to sort by it.
  5. Click PRINT for a PDF copy. This report has no Download.
Report of OPP of Stocking Parts filters
Report of OPP of Stocking Parts column headings
Report of OPP of Stocking Parts list

How do I read the PROFIT column? #

  1. From the Home Screen, click Reports → Shop Expenses & Vendor Reports → Report of OPP of Stocking Parts, run it for your date range and pick a line with a figure in PROFIT.
  2. Take the OPP COST: what you paid the outside supplier. Example: $125.00 for part A11387, stocked as AF6131.
  3. Take the PRIMARY VENDOR COST: what your stocking vendor charges for the same part. Example: $10.92.
  4. PROFIT is the difference between the two, always printed as a positive number. The colour tells you which way it went. Red means you paid the outside supplier more than your stocking vendor would have charged. Green means you paid less, a saving. Example: $125.00 − $10.92 = $114.08, in red: this purchase cost $114.08 more than taking it through your stocking vendor.
  5. Because the number has no minus sign, the colour is the only thing that tells a saving from a loss. On a black-and-white printout or photocopy you cannot tell them apart. Keep the report in colour, or mark the lines before you copy it.
Report of OPP of Stocking Parts profit column in red and green
Report of OPP of Stocking Parts printout

How do I work out the total over- or under-spend for a period? #

  1. From the Home Screen, click Reports → Shop Expenses & Vendor Reports → Report of OPP of Stocking Parts, and run it for your range. Example: 03-20-2026 to 03-24-2026, 15 parts.
  2. Go down the PROFIT column and count every red figure as money lost and every green figure as money saved. Skip the lines showing -. Example: red $114.08 and $0.10, green $3.73, $14.19, $5.13 and $36.13.
  3. Add the reds and take away the greens. Example: $114.08 + $0.10 − $3.73 − $14.19 − $5.13 − $36.13 = $55.00 paid over your stocking vendor's prices, on the six parts that can be compared.
  4. Do not use the figure at the foot of the PROFIT column for this. The foot row totals OPP COST for every line, $575.20 here, but PRIMARY VENDOR COST only for the stocked parts, $117.00. The difference it prints, $458.20 in red, includes the full cost of every part that had nothing to compare against. Only the sum in step 3 compares like with like.
  5. The foot row covers only the page on screen, and there is no report-wide total anywhere on the page. To total a long period, set a range that fits on one page or add the pages together.
Report of OPP of Stocking Parts totals row
About this screen

Total: above the table counts the parts listed. The columns are CATEGORY, OPP PART# (the part number bought outside), INV. STOCK PART# (the matching part in your inventory, when you stock it), INV. NON STOCK PART# (the matching non-stock item, when there is one), DATE, OPP SUPPLIER, SUPPLIER INVOICE NO., OPP COST (what you paid the outside supplier), PRIMARY SUPPLIER NAME (the stocking vendor set on the inventory part), PRIMARY VENDOR COST (what that vendor charges) and PROFIT.

Only parts you stock in inventory can be compared. For any other part, PRIMARY SUPPLIER NAME, PRIMARY VENDOR COST and PROFIT show -. That is expected, not a fault: there is no stocking vendor price to compare against. On most runs, many of the lines look like this.

The printout is headed Report of OPP of Stocking Parts, with the same columns and the same red and green colouring in PROFIT as the screen. Its total row has the same limitation as the screen's.

OPP SUPPLIER is typed when the purchase is entered, and can hold a person's name where a company is expected. To see the same purchases with what the customer was charged for each part, run OPP & Shop Paid Outs Report.


Ask AI